Math 119 Chap 7 part 1
TLDRThis video script introduces Chapter 7 on confidence intervals, focusing on estimating population parameters such as proportions, means, or standard deviations. It explains the concept of point estimates and their limitations, then delves into constructing confidence intervals with associated confidence levels, using examples to illustrate the process. The script also covers calculating sample size needed for a given margin of error and confidence level, emphasizing the importance of prior estimates in reducing required sample sizes.
Takeaways
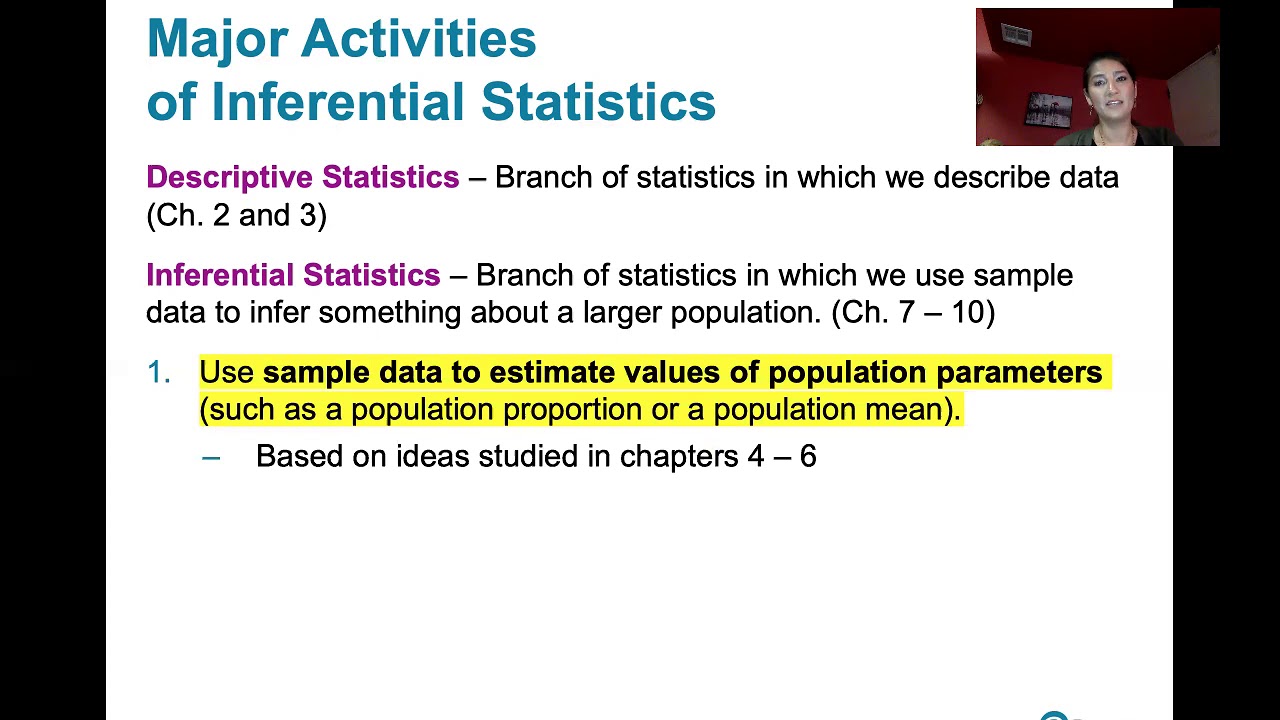
- 📚 The lecture introduces Chapter 7, focusing on confidence intervals for estimating population parameters such as mean, proportion, or standard deviation, with an initial emphasis on population proportion.
- 👨🏫 The instructor explains that a point estimate is a single value used to approximate the population parameter but does not indicate its accuracy.
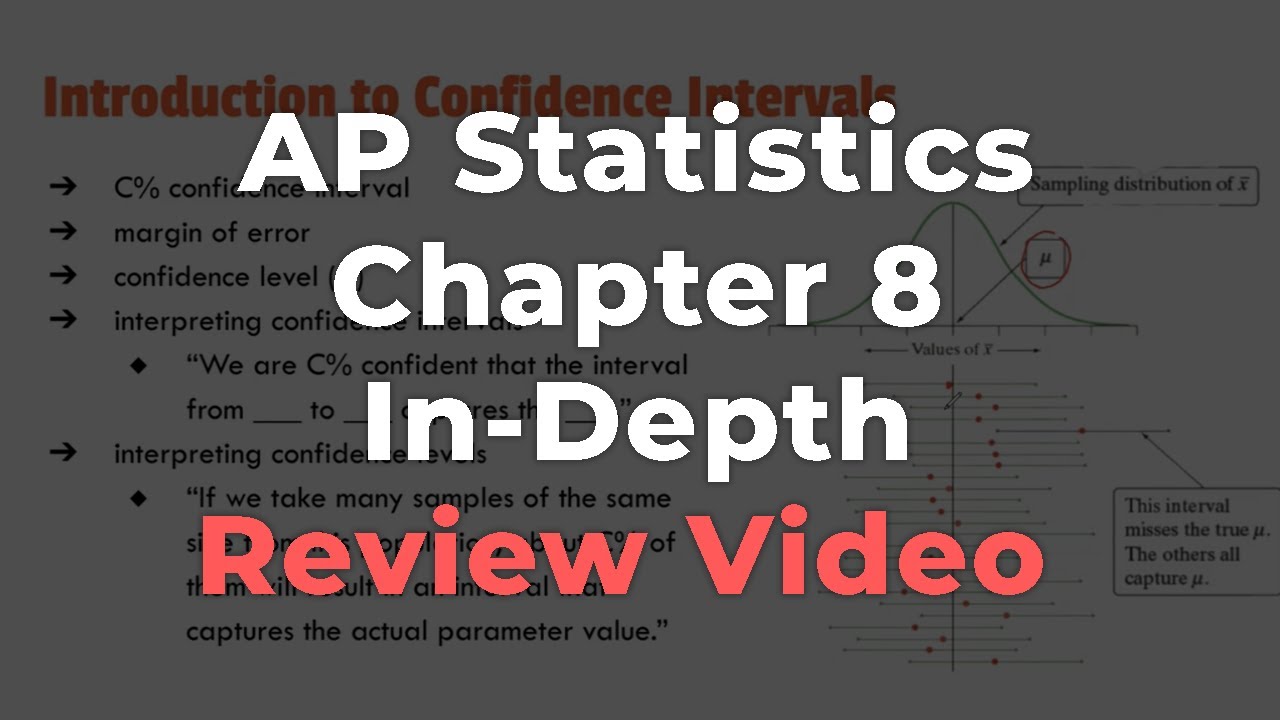
- 🔢 A confidence interval provides a range of values within which the true population parameter is estimated to lie, often associated with a specific confidence level (e.g., 90%, 95%, 99%).
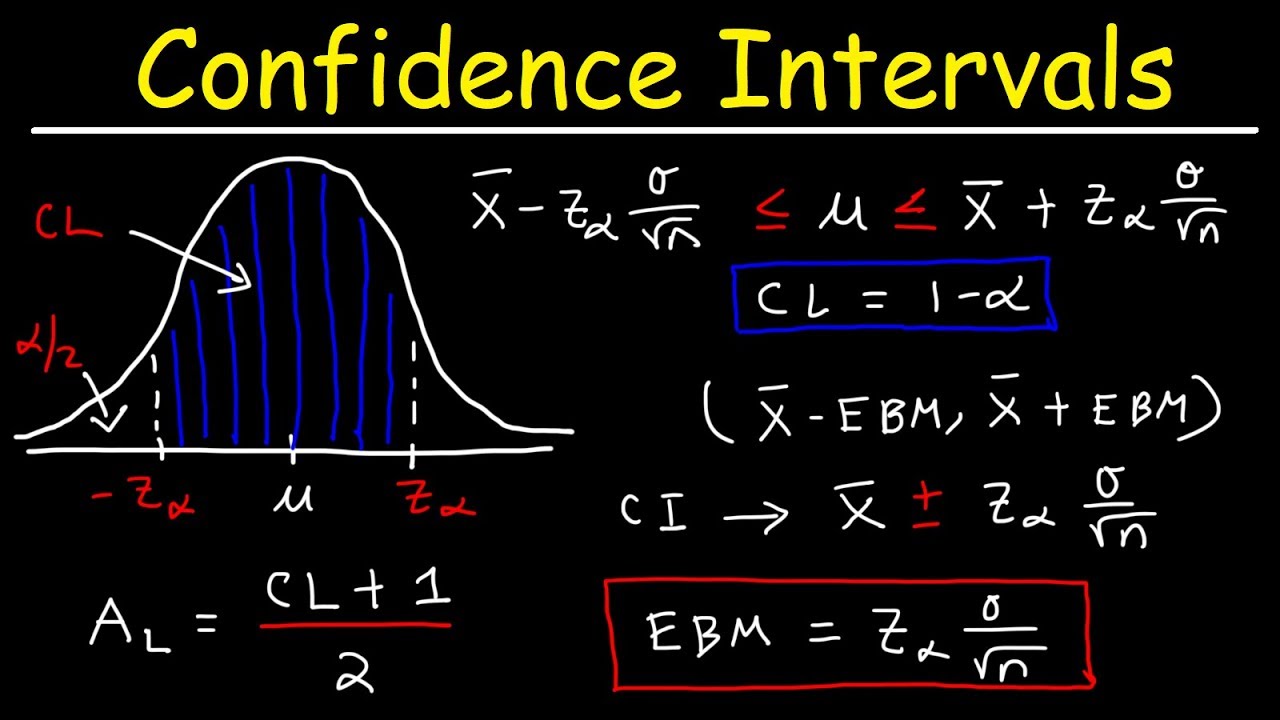
- 📈 The confidence level is expressed as a probability of 1 minus alpha, and it represents the certainty that the interval contains the population parameter.
- 📉 The margin of error is a critical component of the confidence interval, representing the maximum difference between the sample proportion and the true population proportion.
- 📝 The lecture provides a formula for calculating the margin of error using the z-score (z alpha over 2), the sample proportion (p-hat), and the sample size (n).
- 🔍 The process of constructing a confidence interval involves verifying the requirements for estimating a proportion, such as ensuring a simple random sample and meeting binomial conditions.
- 📉 The lecture illustrates the calculation of a confidence interval with an example of patients taking the drug Lipitor, experiencing headaches as a side effect.
- 🛑 The importance of understanding the difference between a regular z-score and a critical value in the context of hypothesis testing and confidence intervals is highlighted.
- 🔧 The video script also covers how to calculate the sample size needed for a given confidence level and margin of error, using an example of estimating the percentage of U.S. households using email.
- 🔄 The impact of having a prior estimate for the population proportion (p-hat) is demonstrated, showing how it can significantly reduce the required sample size for a study.
Q & A
What is the main topic of Chapter 7 discussed in the script?
-The main topic of Chapter 7 is confidence intervals, which are used to make predictions about population parameters such as the mean, proportion, or standard deviation.
What is a point estimate in the context of statistics?
-A point estimate is a single value used to approximate the population parameter. It does not indicate how accurate the estimate is at representing the population parameter.
What is a confidence interval and why is it important?
-A confidence interval is a range of values used to estimate the true value of a population parameter. It is important because it provides a range rather than a single point estimate, giving a more comprehensive understanding of the population parameter with a certain level of confidence.
What is the relationship between confidence level and alpha in a confidence interval?
-The confidence level is associated with a certain level of confidence, often expressed as a probability of 1 minus alpha. The confidence level indicates the probability that the interval contains the population parameter.
What is the formula for calculating the margin of error in a confidence interval for a proportion?
-The margin of error is calculated using the formula: z * sqrt((p_hat * (1 - p_hat)) / n), where z is the z-score corresponding to the desired confidence level, p_hat is the sample proportion, and n is the sample size.
How does the sample size affect the margin of error in a confidence interval?
-The margin of error is inversely proportional to the square root of the sample size. As the sample size increases, the margin of error decreases, leading to a more precise estimate of the population parameter.
What is the purpose of using a z-score in calculating the margin of error?
-The z-score, specifically z_alpha/2, is used to determine the critical value that separates the middle area of the standard normal distribution from the tails. It helps in determining the range of values within which the population parameter is likely to fall with a certain level of confidence.
How can you find the point estimate (p_hat) from a given confidence interval?
-The point estimate (p_hat) can be found by taking the average of the upper and lower limits of the confidence interval, calculated as (upper limit + lower limit) / 2.
What is the significance of the confidence level in determining the width of the confidence interval?
-A higher confidence level, such as 99% compared to 90%, will result in a wider confidence interval. This is because a higher level of confidence requires a larger margin of error to capture a greater area under the normal distribution curve.
Why is it important to verify the requirements for constructing a confidence interval for a proportion?
-Verifying the requirements ensures that the sample is a simple random sample, the conditions for a binomial distribution are met, and there are at least five successes and failures. This validation is crucial for the confidence interval to be a reliable estimate of the population proportion.
Outlines
📚 Introduction to Confidence Intervals
The script introduces Chapter 7, focusing on confidence intervals, which are used to estimate population parameters such as mean, proportion, or standard deviation. It emphasizes the concept of a point estimate and its limitations, explaining that it's a single value estimating the population parameter without indicating its accuracy. The video also explains the definition of a confidence interval as a range of values with an associated confidence level, usually expressed as a percentage (e.g., 90%, 95%, 99%), which represents the level of certainty that the true population parameter lies within the interval.
🔍 Understanding Point Estimates and Margin of Error
This paragraph delves deeper into point estimates, explaining that while they provide a starting value for estimating population parameters, they do not indicate precision. The margin of error (E) is introduced as the maximum difference between the sample proportion (p-hat) and the true population proportion. The importance of calculating the margin of error is highlighted, as it is crucial for constructing a confidence interval, which is the range within which the population parameter is estimated to lie.
📉 Confidence Intervals for Population Proportions
The script discusses the process of constructing a confidence interval for a population proportion, using the sample proportion (p-hat) as the point estimate. It outlines the requirements for estimating a proportion, such as having a simple random sample and satisfying binomial conditions. The formula for calculating the margin of error using the z-score (z-alpha/2) is presented, and the process of building the confidence interval by adding and subtracting the error from the point estimate is explained.
💊 Application of Confidence Intervals in Clinical Trials
An example from a clinical trial involving the drug Lipitor is used to illustrate the calculation of a point estimate for the population proportion of users who experience a side effect (headaches). The script guides through verifying the requirements for constructing a confidence interval and demonstrates the calculation of the error using the z-score for a 90% confidence level. The resulting confidence interval is then interpreted to convey the level of confidence that the true population proportion lies within the interval.
📝 Calculating Confidence Intervals Manually and Using a Calculator
The script contrasts the manual calculation of confidence intervals with using a calculator, emphasizing the importance of understanding the process even when tools are available. It provides a step-by-step guide for both methods, using the example of estimating the population proportion of Lipitor users experiencing headaches. The calculator's accuracy is noted, and the script encourages practice with both approaches to build proficiency.
📊 Interpreting Confidence Intervals and Estimating Population Proportions
This section focuses on interpreting the results of a confidence interval and using it to make inferences about the population. It explains how to construct a statement of confidence, such as being 99% confident that the population proportion is between certain bounds. The script also covers how to find the point estimate from a given confidence interval and how to calculate the margin of error, providing formulas and examples for clarity.
📈 Determining Sample Size for a Sociological Study
The script addresses the question of how to determine the necessary sample size for a study, given a desired confidence level and margin of error. It explains the formula for calculating sample size when no prior estimate of the population proportion (p-hat) is available, using a conservative estimate of p-hat and q-hat as 0.5. The example of estimating the current percentage of U.S. households using email illustrates the calculation process.
🔢 Adjusting Sample Size Based on Prior Estimates
The importance of prior estimates in reducing the required sample size is highlighted. The script demonstrates how using an earlier estimate of the population proportion can significantly decrease the number of households needed for a study. It compares the sample sizes calculated with and without a prior estimate, showing the impact of having a point estimate on the efficiency of the sampling process.
🎓 Conclusion and Preview of Upcoming Content
The script concludes with a summary of the key points covered in the video and a preview of additional content to be addressed in subsequent videos. It emphasizes the practical applications of confidence intervals and sample size calculations in statistical analysis and hints at further examples and problems to be discussed in the next video, focusing on more advanced aspects of chapter seven.
Mindmap
Keywords
💡Confidence Interval
💡Point Estimate
💡Population Proportion
💡Margin of Error
💡Sample Proportion
💡Z-Score
💡Confidence Level
💡Binomial Distribution
💡Sample Size
💡Critical Value
Highlights
Introduction to Chapter 7 focusing on confidence intervals.
Explanation of predicting population parameters such as mean, proportion, or standard deviation.
Clarification that 'proportion' refers to percentages or counts within a population.
Discussion on point estimates as single values to approximate population parameters.
Pointing out that a point estimate alone doesn't indicate accuracy.
Introduction to confidence intervals as a range of values to estimate population parameters.
Definition of a confidence interval and its abbreviation as CI.
Association of confidence intervals with a specific confidence level expressed as a probability.
Common confidence levels of 90%, 95%, and 99% and their relation to alpha.
General template for interpreting and stating confidence intervals.
Use of z-scores for constructing confidence intervals for proportions.
Example problem involving political affiliations and the identification of statistics or parameters.
Explanation of the margin of error and its calculation in confidence intervals.
Process of constructing a confidence interval by adding and subtracting the margin of error.
Demonstration of calculating a 90% confidence interval for a clinical trial involving Lipitor.
Instructions on using a calculator to find confidence intervals for proportions.
Example of constructing a 99% confidence interval for a Pew Research Center survey.
Method to find the point estimate from a given confidence interval.
Technique to calculate the margin of error from a confidence interval.
Calculation of a 95% confidence interval for students receiving coaching for the SAT.
Importance of understanding the difference between a regular z-score and a critical value.
Discussion on determining sample size needed for a study based on desired confidence level and margin of error.
Impact of having a prior estimate on reducing the required sample size for a study.
Conclusion of the video with a summary of key points covered in the introduction to confidence intervals.
Transcripts
Browse More Related Video
AP Statistics Chapter 8 In-Depth Review Video

Elementary Stats Lesson #15

Elementary Statistics - Chapter 7 - Estimating Parameters and Determining Sample Sizes Part 2

Elementary Stats Lesson #16
7.1.0 Estimating a Population Proportion - Lesson Overview, Key Concepts and Learning Outcomes
How To Find The Z Score, Confidence Interval, and Margin of Error for a Population Mean
5.0 / 5 (0 votes)
Thanks for rating: