Descriptive Statistics vs Inferential Statistics
TLDRThe video provides an introduction to descriptive and inferential statistics. Descriptive statistics involves organizing and summarizing data numerically and graphically to describe its shape and central tendency. Inferential statistics uses sample data to make inferences about a larger population through techniques like confidence intervals. A key example shows how a small sample that prefers blue cars can allow estimates of how many in a city's full population prefers blue cars, especially as the sample size increases.
Takeaways
- 😀 Descriptive statistics involves organizing and summarizing data using graphs and numbers
- 📊 Measures of central tendency like mean, median and mode can describe data numerically
- 📈 Graphs like histograms, bar charts and pie charts can describe shape and categories of data
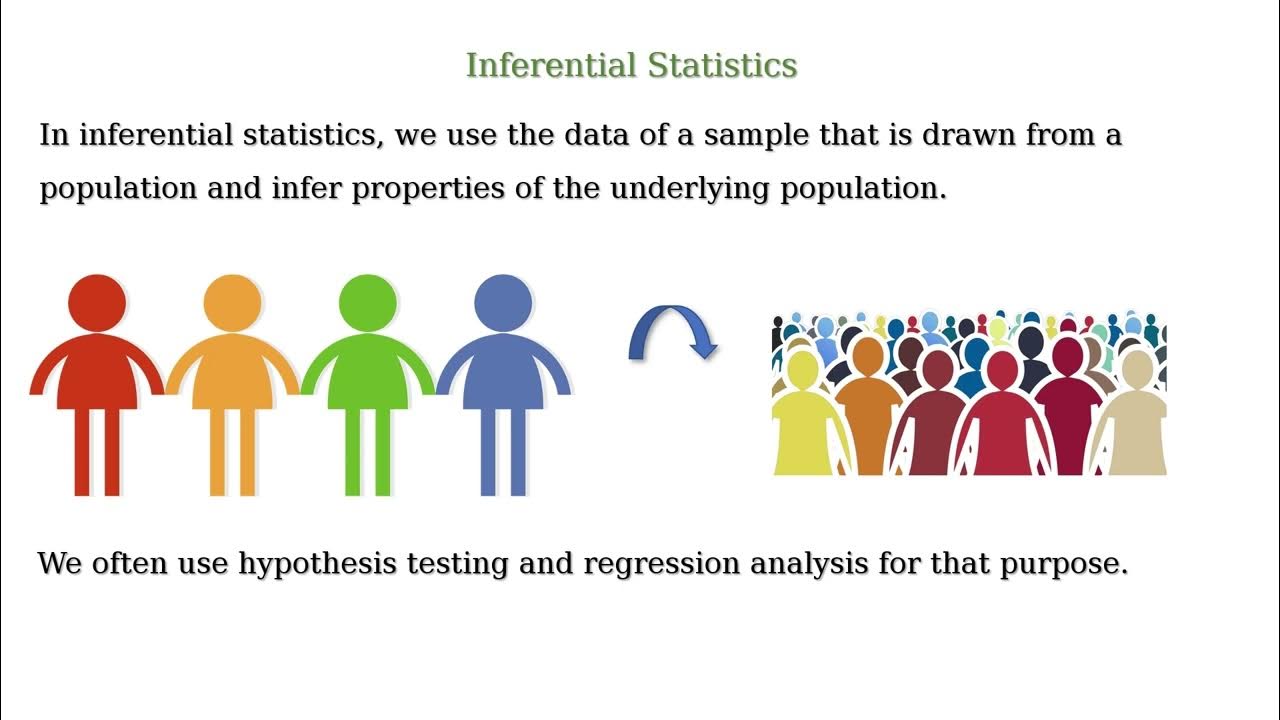
- 🌎 Inferential statistics uses sample data to make inferences about a population
- 🎯 Probability helps determine how confident inferences about a population are
- 👥 Using a sample to make inferences on a population is more practical than surveying the entire population
- 🔢 Larger sample sizes can increase confidence in inferences made about the population
- 📐 Confidence intervals quantify the certainty of inferences from a sample to a population
- 📊 Descriptive statistics presents facts about data like samples and frequencies
- 🔮 Inferential statistics makes predictions about populations using sample data
Q & A
What are the two main branches of statistics?
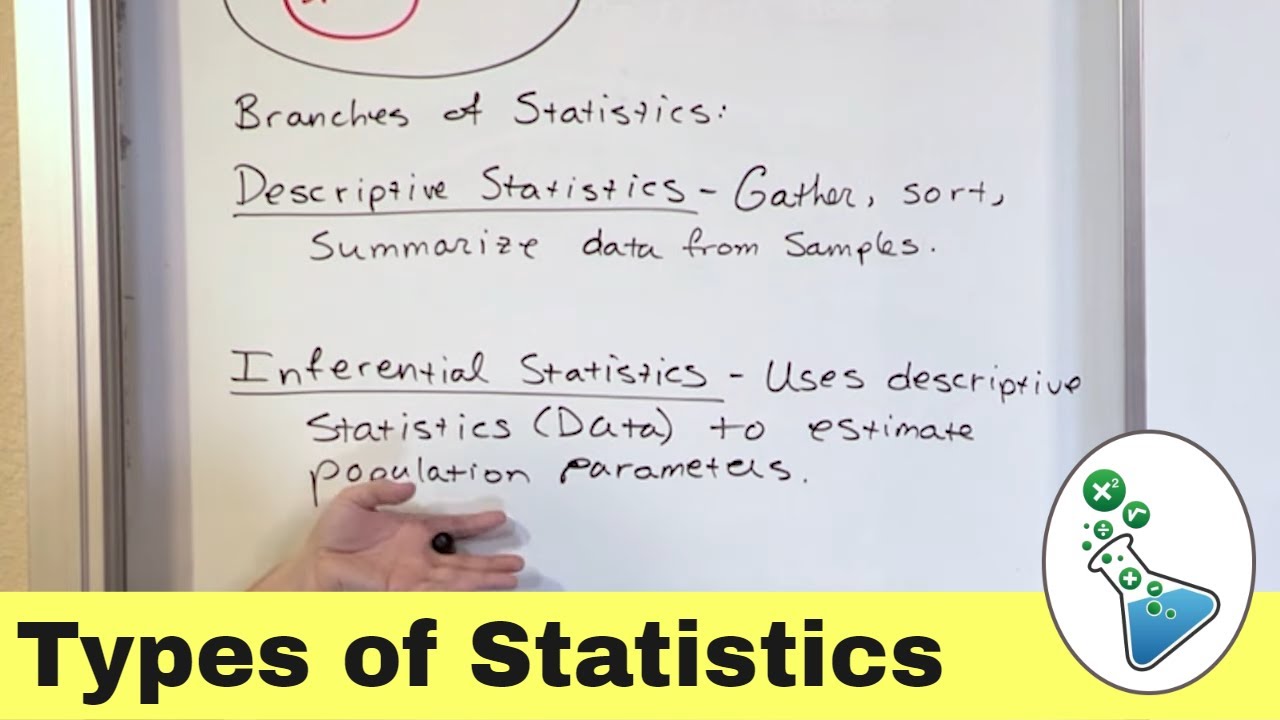
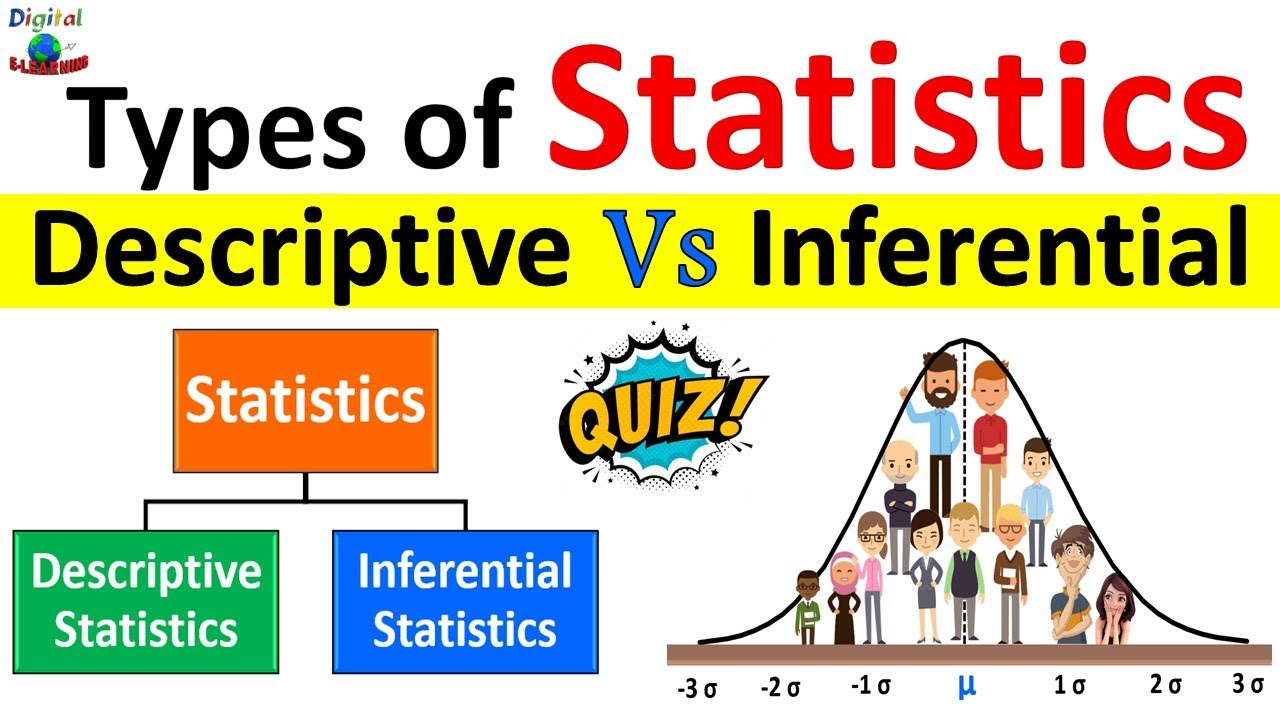
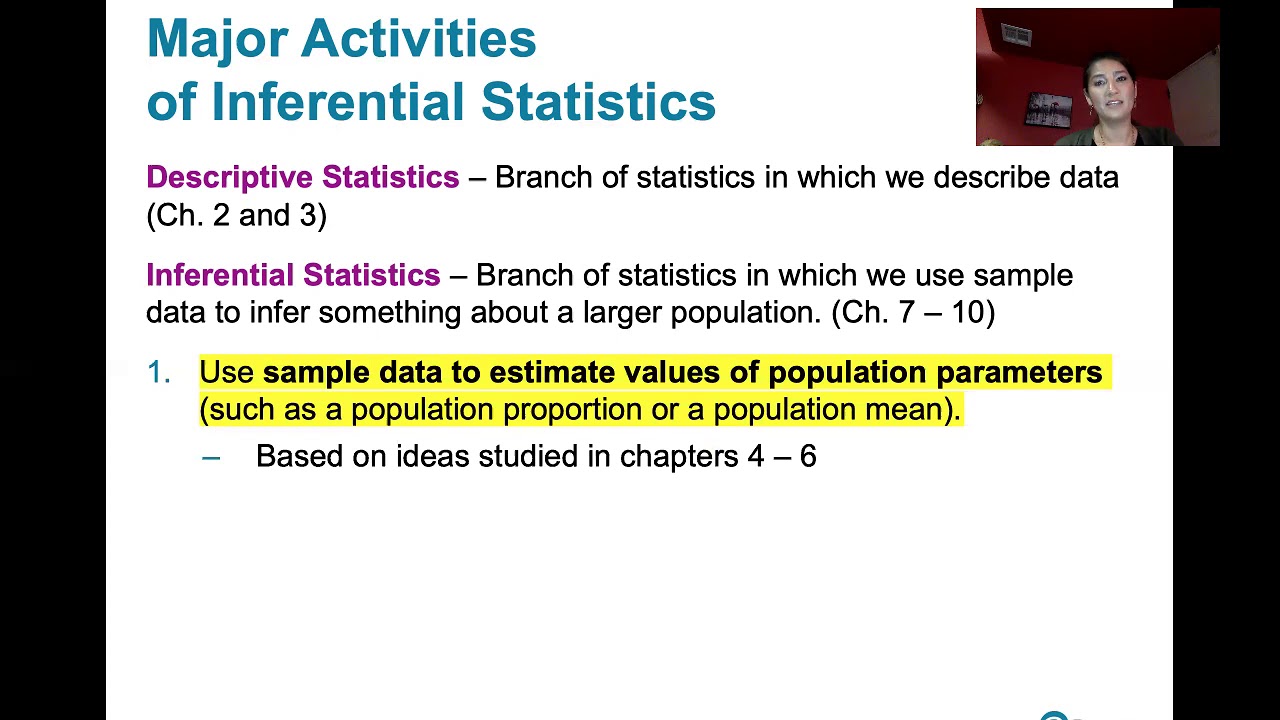
-The two main branches of statistics are descriptive statistics and inferential statistics. Descriptive statistics involves organizing and summarizing data using graphs, charts, tables, etc. Inferential statistics involves making inferences about a population based on a sample.
What are some ways to visualize data in descriptive statistics?
-Some ways to visualize data in descriptive statistics include bar graphs, histograms, pie charts, line graphs, frequency tables, and frequency distribution tables.
What are measures of central tendency in descriptive statistics?
-Measures of central tendency in descriptive statistics include the mean, median, and mode. The mean is the average, the median is the middle number, and the mode is the number that occurs most frequently.
What is the difference between a sample mean and a population mean?
-The sample mean is the average calculated from a sample of data, while the population mean is the average for the entire population that the sample is drawn from.
What does inferential statistics allow us to do?
-Inferential statistics allows us to use sample data to make inferences and draw conclusions about the broader population that the sample represents.
How can we determine the confidence of our conclusions in inferential statistics?
-We can use probability and confidence intervals to determine how confident we can be that the conclusions we make based on our sample data accurately reflect the broader population.
What factors allow us to make better predictions about a population?
-Having a larger sample size and lower margin of error allows us to make better predictions about a population based on sample data.
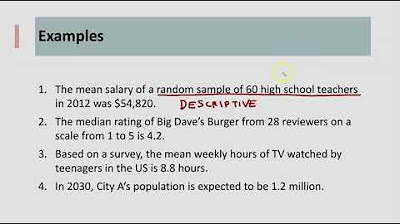
When would descriptive statistics be used vs. inferential statistics?
-Descriptive statistics would be used simply to present or summarize data, while inferential statistics would be used to make conclusions or predictions about a broader population based on sample data.
What is the purpose of increasing sample size in inferential statistics?
-Increasing sample size allows inferential statistics to better reflect the broader population that the sample represents, improving confidence and lowering the margin of error.
How can probability and confidence intervals be used in inferential statistics?
-We can assign a probability percentage that expresses our confidence that the inferences from our sample data accurately reflect the broader population, within a certain margin of error or confidence interval.
Outlines
😊 Descriptive vs. Inferential Statistics Overview
The paragraph provides an introduction and overview of descriptive and inferential statistics. It explains that descriptive statistics involves organizing and summarizing data using graphs and numbers, while inferential statistics involves making inferences about a population from a sample. Examples of descriptive statistics methods include bar graphs, histograms, pie charts, measures of central tendency, and variability. The paragraph also briefly introduces confidence intervals and margin of error in the context of inferential statistics.
i️ Using a Sample to Make Inferences
This paragraph provides an illustrative example of using a sample to make inferences about a population, highlighting the difference between descriptive and inferential statistics. It discusses taking a sample of 100 people to estimate the broader population's preference for blue cars. Reporting the percentage from the sample is descriptive statistics, while using that to draw conclusions about the full population is inferential statistics. It also explains how increasing sample size can improve confidence in the population estimate.
Mindmap
Keywords
💡descriptive statistics
💡inferential statistics
💡sample mean
💡population mean
💡confidence interval
💡margin of error
💡sample size
💡mean
💡median
💡mode
Highlights
Descriptive statistics involves organizing and summarizing data using graphs and numbers
Inferential statistics uses sample data to make inferences about a population
Measures of central tendency like mean, median and mode describe data numerically
Other descriptive statistics include range, variance and standard deviation
Inferential statistics uses probability to determine confidence in conclusions
Taking a sample from a population and making inferences is more practical than surveying the entire population
The sample percentage preferring blue cars is descriptive statistics based on sample data
Using the sample data to estimate the population percentage preferring blue cars is inferential statistics
Confidence intervals quantify the certainty in the population estimate from the sample
Larger sample sizes improve population estimates and confidence intervals
Descriptive statistics presents facts like the percentage from a sample
Inferential statistics estimates the wider population based on the sample
Confidence intervals show how precise the population estimate is
Bigger samples make estimates and confidence intervals more accurate for the population
Using sample data for population inference defines inferential statistics
Transcripts
Browse More Related Video
What is Descriptive Vs. Inferential Statistics?
Descriptive Statistics vs Inferential Statistics | Measure of Central Tendency | Types of Statistics
7.1.0 Estimating a Population Proportion - Lesson Overview, Key Concepts and Learning Outcomes
Descriptive vs Inferential Statistics

Math 119 Chapter 3 intro
Descriptive Statistics vs. Inferential Statistics
5.0 / 5 (0 votes)
Thanks for rating: