9.1.0 Two Proportions - Lesson Overview, Key Concepts, Learning Outcomes
TLDRThis video offers an insightful lesson on making inferences about two proportions from Chapter 9 of 'Essentials of Statistics' by Mario Triola. It focuses on hypothesis testing and constructing confidence intervals for two population proportions, extending concepts from earlier chapters. The lesson aims to help viewers understand the rationale behind using different statistical methods, including the p-value, critical value, and confidence interval approaches, and discusses alternative options when standard requirements are unmet.
Takeaways
- 📚 The video is a lesson overview of Lesson 9.1 from Chapter 9 of 'Essentials of Statistics' by Mario Triola, focusing on making inferences about two proportions.
- 🔍 Inferences about two samples are crucial for comparing groups, such as the effectiveness of a drug or generalizations about gender behaviors, using statistical methods.
- 📈 Lesson 9.1 specifically deals with inferences about two population proportions, while Lesson 9.2 will cover inferences about two means with independent samples.
- 🚫 Due to time constraints, Lesson 9.3, which discusses dependent samples, will not be covered but is available for self-study in the textbook.
- 🧠 The content builds upon the hypothesis testing and confidence interval concepts introduced in Chapters 7 and 8, extending these to comparisons between two groups.
- 📝 Key concepts include testing claims about two proportions using the p-value method, critical value method, or confidence interval method.
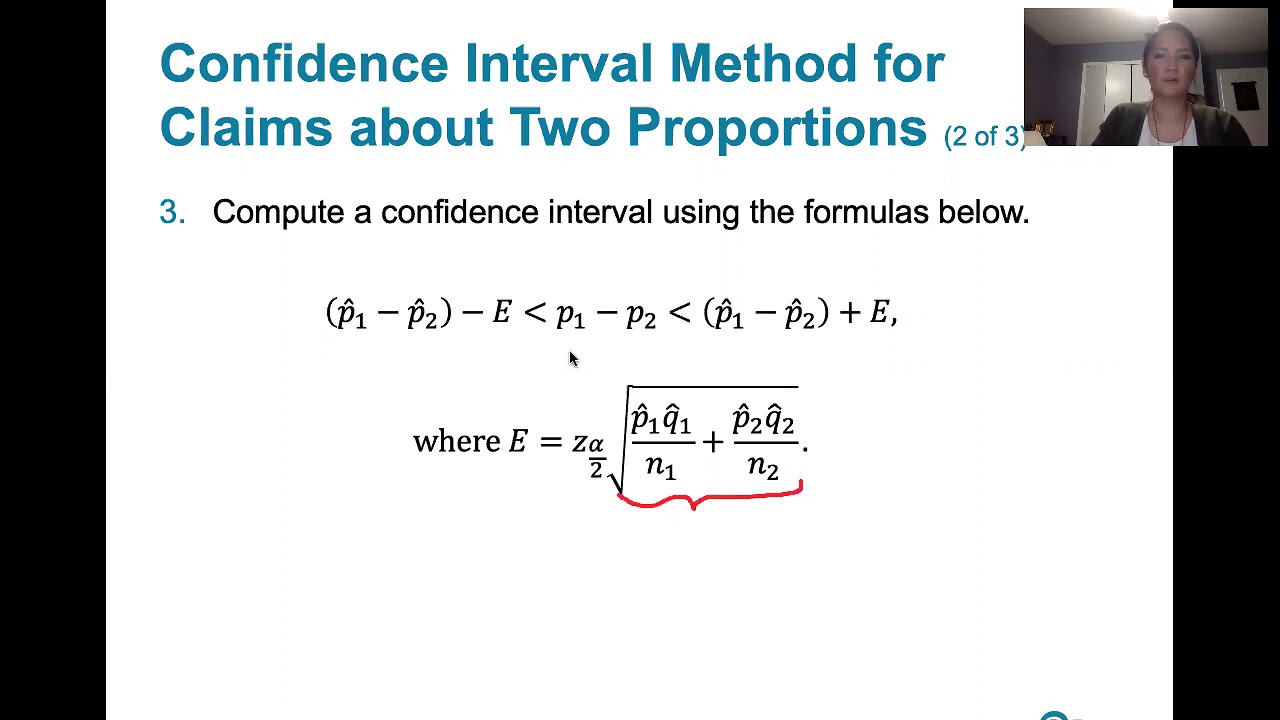
- 📊 The video will teach how to construct a confidence interval estimate for the difference between two proportions, explaining the rationale and formulas behind these methods.
- 🤔 The lesson aims to help viewers understand the rationale behind the p-value and critical value methods for testing claims about two proportions.
- 📉 It will also cover the basic procedure for hypothesis testing, including the test statistic and the pooled sample proportion.
- 🔄 The video discusses what to do when the requirements for using these statistical methods are not met, offering alternative approaches for hypothesis testing and confidence interval construction.
- 🎯 The learning outcomes for the lesson are to describe the rationale behind the formulas, outline the hypothesis testing procedure, and discuss the differences between the p-value, critical value, and confidence interval methods.
Q & A
What is the primary focus of Lesson 9.1 in the video?
-Lesson 9.1 focuses on making inferences about two population proportions using statistical methods.
Why are inferences about two samples important in statistics?
-Inferences about two samples are important because they allow us to compare effectiveness, such as between a treatment group and a placebo group, or to make generalizations about differences between groups.
What are the two main types of inferences covered in Chapter 9 of the textbook?
-Chapter 9 covers inferences about two population proportions and inferences about two means.
What is the significance of comparing the methods used for testing claims about two proportions?
-Comparing these methods helps to understand their similarities and differences, and why certain formulas are used, ensuring that the conclusions drawn from them are equivalent.
What are the three methods mentioned for testing a claim about two proportions?
-The three methods are the p-value method, the critical value method, and the confidence interval method.
Why is it important to understand the rationale behind the formulas used in hypothesis testing?
-Understanding the rationale behind the formulas is crucial for grasping the underlying principles of hypothesis testing and for applying these methods correctly.
What is the pooled sample proportion and why is it used in hypothesis testing?
-The pooled sample proportion is a combined measure of the two sample proportions used to estimate the population proportion in hypothesis testing about two proportions.
What does the video suggest for students interested in learning more about dependent samples?
-The video suggests that students can learn more about dependent samples from Section 9.3 of the textbook, which was not covered due to time constraints.
What are the learning outcomes the instructor hopes to achieve by the end of Lesson 9.1?
-The learning outcomes include understanding the rationale behind hypothesis testing methods, describing the test statistic and its distribution, and discussing the options for testing hypotheses when the requirements are not met.
How does the instructor plan to help students understand the rationale behind the hypothesis testing formulas?
-The instructor plans to discuss the rationale in the context of the sampling distribution of the sample proportion, which was introduced in Chapter 6.
What is the purpose of constructing a confidence interval estimate for the difference between two proportions?
-The purpose is to provide a range of values within which the true difference between the two population proportions is likely to fall, indicating the level of uncertainty in the estimate.
Outlines
📚 Introduction to Inference on Two Proportions
This paragraph introduces the topic of making inferences about two population proportions, which is the focus of Lesson 9.1. It discusses the importance of comparing groups, such as the effectiveness of a drug between a treatment and placebo group, or generalizing differences between genders in psychology studies. The material is based on Chapter 9 from 'Essentials of Statistics' by Mario Triola, which covers inferences from two samples. The lesson is part of a broader study on hypothesis testing and confidence intervals, extending knowledge from previous chapters. The paragraph outlines the structure of the lesson, including the methods for testing claims about two proportions using the p-value, critical value, and confidence interval methods, and the importance of understanding the rationale behind these methods. It also mentions the learning outcomes, which aim to equip students with the ability to describe the procedures and rationale for hypothesis testing and to apply these methods to practical problems.
🔍 Hypothesis Testing Methods and Requirements
The second paragraph delves into the specifics of hypothesis testing methods for two proportions, emphasizing the p-value method, critical value method, and confidence interval method. It discusses the importance of understanding the rationale behind these methods and their equivalence in reaching conclusions. The paragraph also addresses the requirements for using these methods and what to do when these requirements are not met. It outlines the learning outcomes related to applying the p-value method to test a claim about two proportions, using the critical value method as an alternative, and constructing a confidence interval estimate for the difference between two population proportions. The goal is for students to describe the rationale behind the formulas and discuss the differences between the methods. The paragraph concludes with a mention of the next video, which will discuss the rationale behind the formulas used for hypothesis testing, particularly the sampling distribution of p-hat.
Mindmap
Keywords
💡Inferences
💡Proportions
💡Hypothesis Testing
💡Confidence Intervals
💡P-Value Method
💡Critical Value Method
💡Treatment Group
💡Placebo Group
💡Pooled Sample Proportion
💡Requirements
💡Essentials of Statistics
Highlights
Lesson 9.1 focuses on making inferences about two proportions, which is crucial for comparing groups such as the effectiveness of a drug.
The material is based on 'Essentials of Statistics' by Mario Triola, specifically the sixth edition, chapter nine.
Inferences about two samples are important for understanding differences between groups, such as in psychology studies.
The chapter extends concepts from chapters seven and eight about hypothesis tests and confidence intervals.
Lesson 9.1 and 9.2 involve conducting hypothesis tests and constructing confidence intervals for two population proportions and means.
The instructor modified the slides provided by Pearson for the course, indicating a tailored approach to teaching.
Due to time constraints, lesson 9.3 on dependent samples is not covered, but the book offers additional information.
Key concepts include testing claims about two proportions using the p-value method, critical value method, or confidence interval method.
Students are expected to understand the rationale behind the p-value and critical value methods for hypothesis testing.
The video outlines the basic procedure for hypothesis testing, emphasizing the importance of understanding the process.
The test statistic and the distribution of p1 hat minus p2 hat are discussed, along with the pooled sample proportion.
Learning outcomes include describing the rationale behind the formulas used for hypothesis testing and their practical applications.
The video aims to help students apply the p-value method to test claims about two proportions, similar to homework or exam problems.
The critical value method is also explored as an alternative to the p-value method for hypothesis testing.
Constructing a confidence interval estimate for the difference between two population proportions is a key learning outcome.
Students are expected to discuss the differences between the p-value, critical value, and confidence interval methods for hypothesis testing.
The video concludes with options for testing hypotheses and constructing confidence intervals when standard requirements are not met.
Transcripts
Browse More Related Video
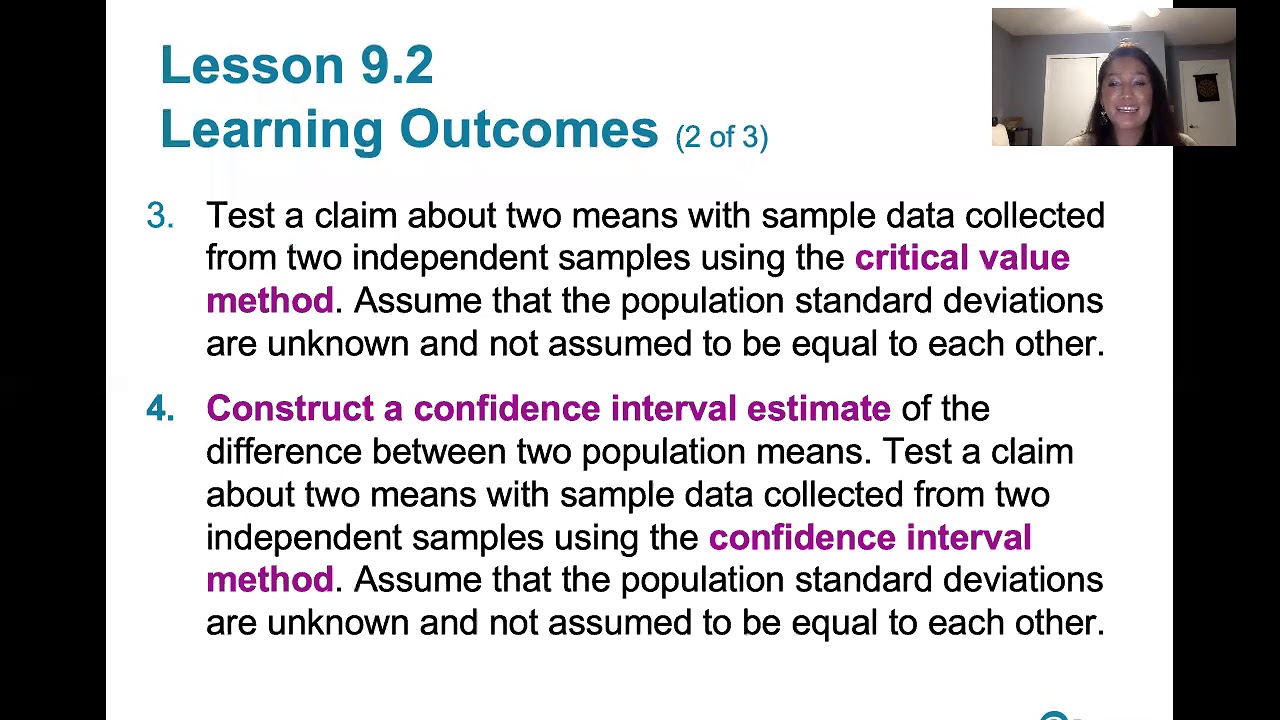
9.2.0 Two Means, Independent Samples - Lesson Overview, Learning Outcomes, Key Concepts
8.2.2 Testing a Claim About A Proportion - Confidence Interval Method, Comparison to Other Methods
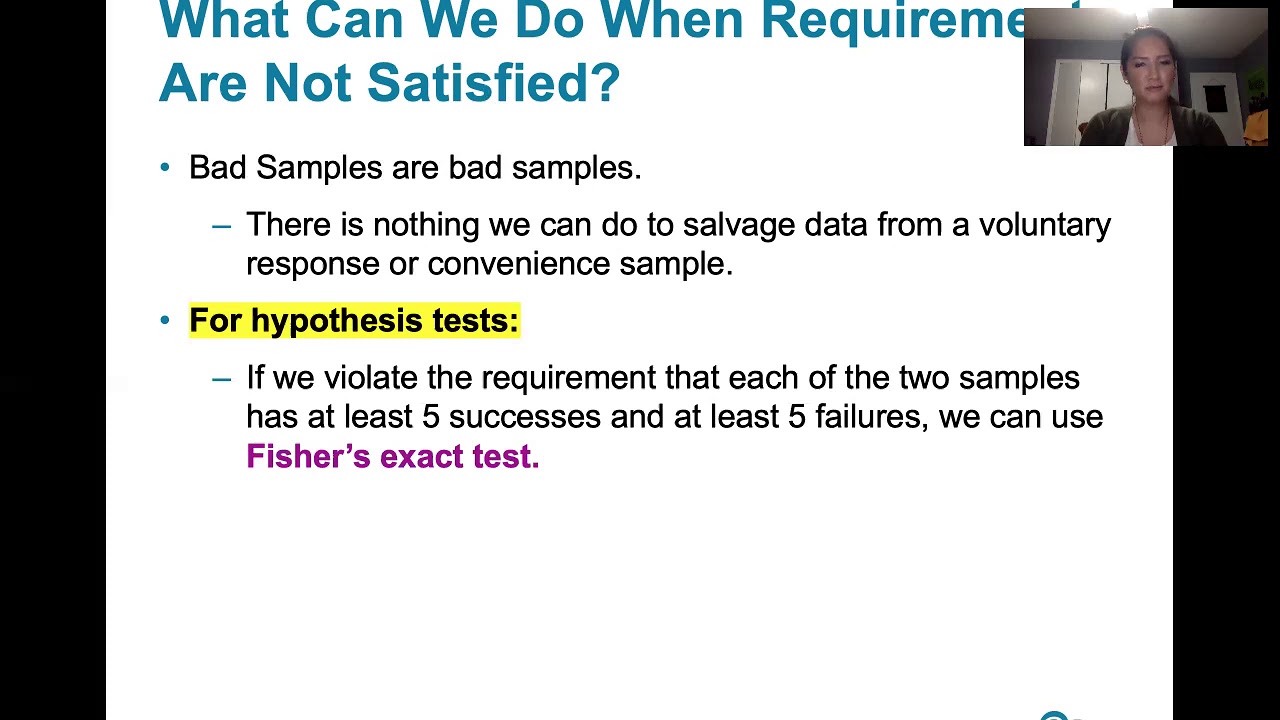
9.1.5 Two Proportions - Hypothesis Testing and Confidence Intervals When Requirements Are Not Met
9.1.4 Two Proportions - Confidence Intervals for the Difference Between Two Proportions
7.1.0 Estimating a Population Proportion - Lesson Overview, Key Concepts and Learning Outcomes
8.2.0 Testing a Claim About a Proportion - Lesson Overview, Learning Outcomes, Key Concepts
5.0 / 5 (0 votes)
Thanks for rating: