STAT243Z 02/29/24 Zoom Recording
TLDRThe video script covers a statistics lesson focusing on confidence intervals for population means and proportions. It introduces the concept of t-distribution, explains its relation to z-scores, and illustrates the calculation of confidence intervals using both sample data and descriptive statistics tools in Excel. The instructor guides students through examples, comparing t and z distributions, and demonstrates how to determine sample size for a given margin of error and confidence level. The session also includes an apology for the instructor's dog's disruptive noises and a lab exercise to apply the concepts learned.
Takeaways
- 📚 The class is covering the remaining sections of Chapter 9 and moving on to Chapter 10, which builds upon the material from Chapter 9.
- 🔍 Section 9.2 focuses on point estimates for population means and introduces the concept of a t-distribution, explaining its use and significance.
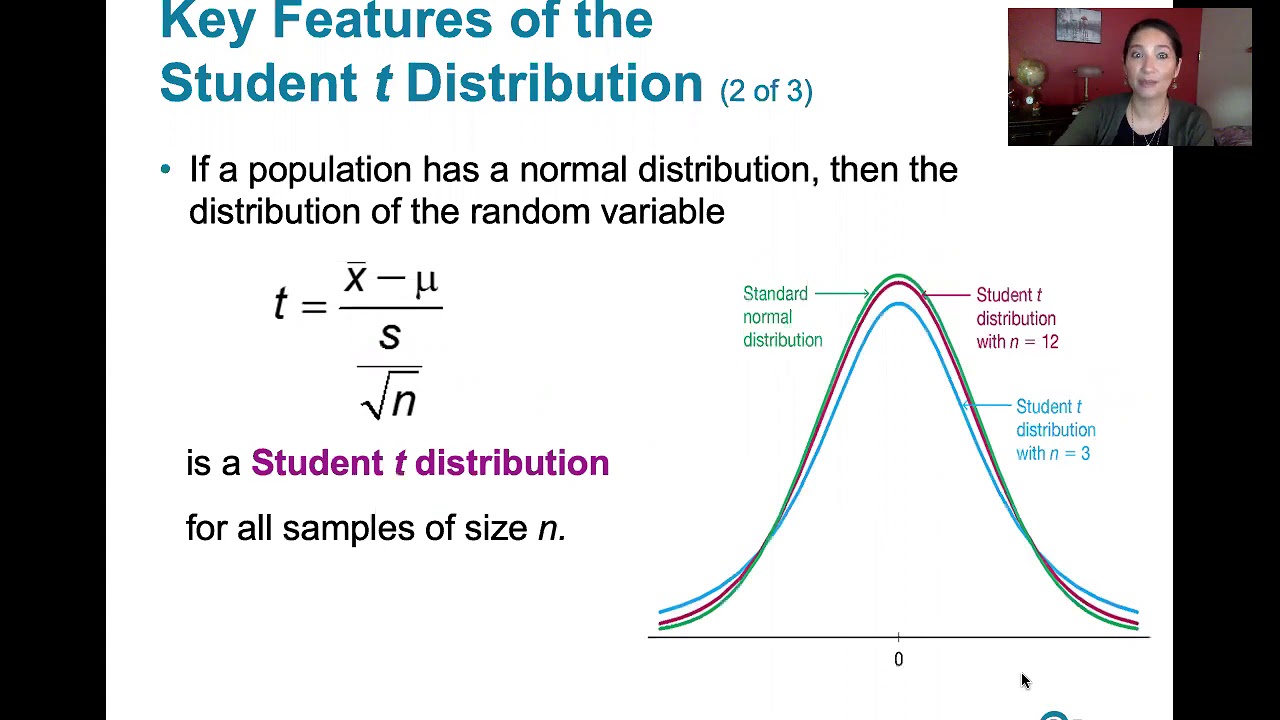
- 📈 The t-distribution is compared to the normal (z) distribution, highlighting that the t-distribution is more appropriate for smaller sample sizes and when the population standard deviation is unknown.
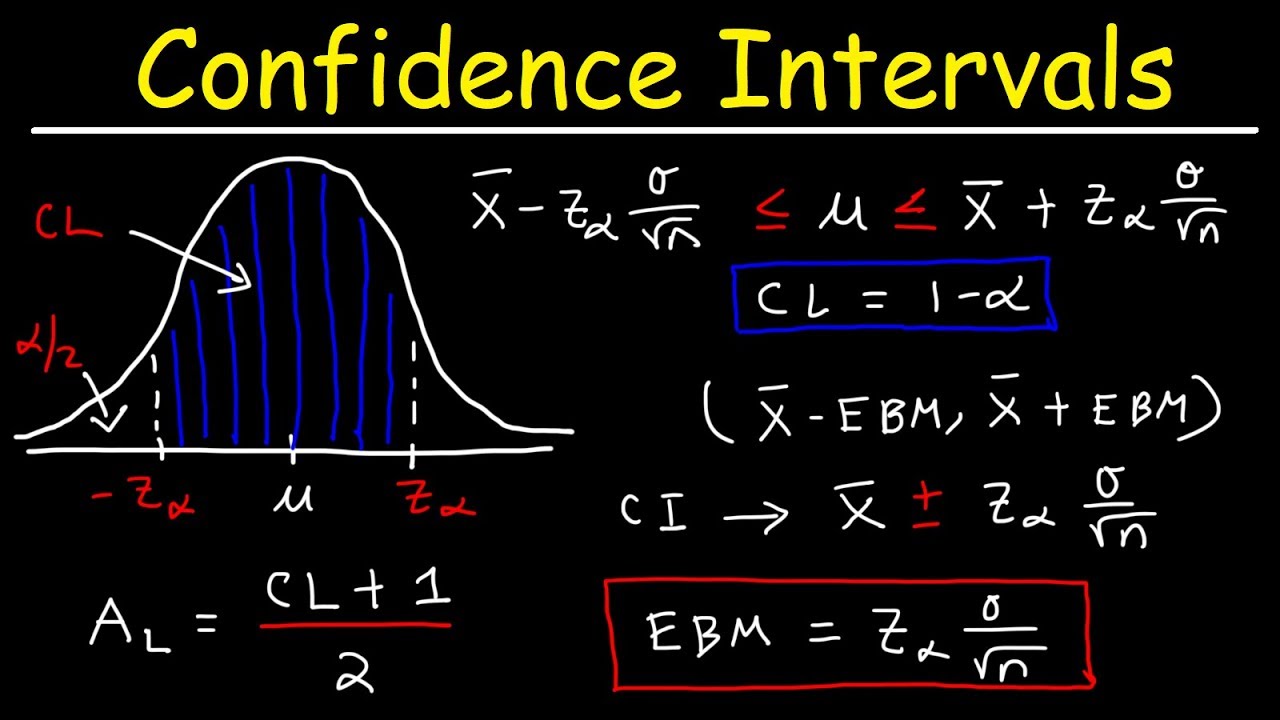
- 📝 Confidence intervals for population means are discussed, including how to calculate them using the t-distribution and sample data.
- 🔢 The process of finding a sample size for estimating the population mean with a specific margin of error is explained, paralleling a similar process done earlier for proportions.
- 🧐 The lab exercise involves using previously introduced tools, specifically the descriptive statistics box, to apply the concepts learned in the lecture.
- 📉 The instructor demonstrates how to calculate and interpret confidence intervals for sample data, including using the t-table and calculator functions.
- 📚 The script includes an example using the weight of pennies to illustrate the calculation of a point estimate and a confidence interval.
- 🚗 Another example uses data from the website fueleconomy.gov to construct a confidence interval for the mean miles per gallon of Ford Focus automobiles.
- 🔧 The importance of understanding the difference between using z-scores and t-scores is emphasized, particularly in the context of sample size and data availability.
- ❓ The instructor addresses potential student questions and clarifies the use of z-scores for proportions and t-scores for means in their class, noting that this distinction may vary in more advanced courses.
Q & A
What are the main topics covered in the script?
-The script covers the following topics: point estimates for population means, the t-distribution, confidence intervals for population means, and calculating sample size for estimating the population mean with a specific margin of error.
What is a point estimate for population means?
-A point estimate for population means is the sample mean (x̄) used to estimate the population mean. It is derived from a sample and serves as a single value that best represents an unknown population parameter.
Why is the t-distribution used instead of the normal distribution in certain scenarios?
-The t-distribution is used when the sample size is small (usually less than 30) and the population standard deviation is unknown. It accounts for the additional uncertainty in estimating the population parameter from a small sample.
How does the t-distribution differ from the z-distribution?
-The t-distribution has longer tails than the z-distribution, which means it accounts for more variability in the data. It is more appropriate for smaller sample sizes, whereas the z-distribution is used for larger sample sizes or when the population standard deviation is known.
What is a confidence interval and why is it used?
-A confidence interval is a range within which we expect the population parameter to lie with a certain level of confidence. It is used to provide an estimate of the population parameter with a specified level of uncertainty.
How is the margin of error calculated in the context of confidence intervals for means?
-The margin of error is calculated as the t-value (found using the t-distribution and the desired level of confidence) multiplied by the standard error of the mean, which is the sample standard deviation divided by the square root of the sample size (n).
What is the purpose of calculating the sample size for estimating a population mean?
-Calculating the sample size is important to determine how many observations are needed to estimate the population mean with a specific margin of error and confidence level. This ensures that the sample is large enough to provide a reliable estimate.
What is the relationship between sample size and the t-value?
-The t-value is dependent on the degrees of freedom, which is the sample size minus one (n-1). As the sample size increases, the t-distribution approaches the normal distribution, and the t-value becomes more similar to the z-score.
How does the script instructor handle the use of technology during the lesson?
-The instructor acknowledges technical difficulties, such as issues with the iPad, and attempts to navigate through them while continuing to teach. The instructor also uses a calculator to demonstrate the calculations and provides guidance on using the calculator for confidence intervals.
What is the significance of the 'degrees of freedom' in the context of the t-distribution?
-The degrees of freedom in the context of the t-distribution is related to the sample size and is used to determine the shape of the t-distribution curve. It is calculated as the sample size minus one (n-1) and affects the spread of the distribution.
How does the instructor address the potential confusion between t-scores and z-scores?
-The instructor clearly distinguishes between t-scores and z-scores by explaining the scenarios in which each is used, emphasizing that t-scores are used for smaller sample sizes and when the population standard deviation is unknown, while z-scores are used for larger sample sizes or known population parameters.
Outlines
📚 Course Content Overview and Upcoming Sections
The instructor provides a brief overview of the remaining course material, indicating that after completing section 9.2 and chapter 9, they will conclude with chapter 10. Chapter 10 is said to build upon chapter 9, adding complexity but not being overly complicated. The session's focus is on understanding means, specifically point estimates for population means, the introduction of the t-distribution, and confidence intervals for population means. The instructor also mentions a lab exercise that will utilize previously learned tools and welcomes a student named Elena, apologizing for potential disruptions caused by their dog.
📈 Understanding Point Estimates and the T-Distribution
The instructor explains the concept of point estimates, using the sample mean (x̄) as an example to estimate the population mean. They delve into the t-distribution, comparing it to the normal distribution and explaining its use with smaller sample sizes. The t-distribution is characterized by having longer tails and is more appropriate for samples where the population standard deviation is unknown. The explanation includes a comparison of histograms for both z-scores and t-scores, illustrating how the t-distribution accommodates the increased variability in smaller samples.
📉 T-Distribution Characteristics and When to Use It
The instructor further discusses the t-distribution, emphasizing its use with sample data and smaller sample sizes, as opposed to the z-distribution, which is used with larger sample sizes or when the population standard deviation is known. They clarify that the t-distribution is always based on sample data and is particularly suitable for sample sizes less than 30. The explanation includes the concept of degrees of freedom, which is related to the sample size, and how it affects the shape of the t-distribution.
🔢 Calculating T-Values and Understanding Confidence Intervals
The instructor demonstrates how to calculate t-values using a t-table and a calculator, explaining the significance of the area under the curve and how it relates to the t-value. They discuss the concept of confidence intervals, providing a step-by-step guide on how to construct them using sample data. The explanation includes how to find the margin of error using the t-value, sample standard deviation, and sample size.
🛠️ Lab Exercise Overview and Using Descriptive Statistics
The instructor outlines the lab exercise for the day, which involves using the descriptive statistics tool to analyze continuous data. They guide students through the process of using the tool in Excel, emphasizing the ease and speed of the exercise due to the familiarity with the tools from previous sessions. The lab aims to reinforce the concepts learned in the lecture by applying them to a practical dataset.
📝 Final Project Considerations and Confidence Interval Application
Towards the end of the session, the instructor touches upon the final project, suggesting that the concepts of confidence intervals could be applied if students wish to estimate population means within their projects. They encourage students to consider the relevance of these statistical tools to their individual projects and to discuss any questions or concerns in the class forums for the benefit of all students.
🤔 Addressing Questions and Wrapping Up the Session
The instructor concludes the session by addressing any remaining questions from students and summarizing the key points covered during the class. They reiterate the importance of understanding the material and encourage students to apply the concepts learned to their final projects. The session ends with the instructor ensuring that all students are clear on the material and are ready to proceed with their assignments.
Mindmap
Keywords
💡Point Estimate
💡T Distribution
💡Confidence Interval
💡Sample Size
💡Margin of Error
💡Degrees of Freedom
💡Population Mean
💡Sample Mean
💡Standard Deviation
💡Descriptive Statistics
Highlights
Introduction to Section 9.2 and the remaining chapters, emphasizing the continuity from Chapter 9 to Chapter 10.
Exploration of means in statistics, specifically point estimates for population means.
Introduction of the t-distribution and its application in statistics.
Explanation of confidence intervals for population means, paralleling the process done previously for proportions.
Lab activities using familiar tools for descriptive statistics.
Apology for the dog's disruptive noises during the session.
Discussion on point estimates using sample mean (x̄) to estimate the population mean.
Explanation of the t-value calculation and its similarity to the z-score.
Differentiation between t-distribution and z-distribution based on sample size and data type.
Illustration of t-distribution characteristics with histograms for different sample sizes.
Clarification that t-distribution is used with sample data and smaller sample sizes.
Demonstration of how t-distribution approaches a normal distribution as sample size increases.
Calculation of the t-value using a t-table and inverse T function on a calculator.
Construction of a confidence interval for a sample mean using the t-distribution.
Example calculation of a 99% confidence interval for the weight of pennies.
Use of technology, specifically calculators, for finding t-values and constructing confidence intervals.
Instructions for a lab exercise using the descriptive statistics tool in Excel.
Final project considerations and the potential application of confidence intervals.
Transcripts
Browse More Related Video
7.2.1 Estimating a Population Mean - Student t Distribution and Finding Critical t Values
How To Find The Z Score, Confidence Interval, and Margin of Error for a Population Mean
AP Statistics Chapter 8 In-Depth Review Video

Elementary Statistics - Chapter 7 - Estimating Parameters and Determining Sample Sizes Part 2
7.1.0 Estimating a Population Proportion - Lesson Overview, Key Concepts and Learning Outcomes

Elementary Stats Lesson #15
5.0 / 5 (0 votes)
Thanks for rating: