3.3.3 Measures of Relative Standing and Boxplots - Quartiles and the 5 Number Summary
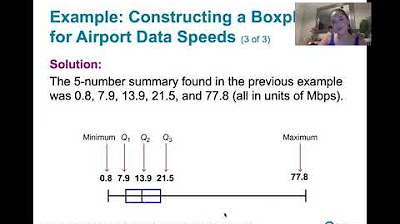
TLDRThis video tutorial delves into the concept of quartiles and the five-number summary for data analysis. Quartiles, represented as Q1, Q2, and Q3, divide data into four parts, each containing approximately 25% of the values. The script clarifies that quartiles are percentiles and emphasizes the variability in their calculation methods. It introduces the interquartile range, semi-interquartile range, and the 10-90 quartile range as measures of data spread. The five-number summary, consisting of the minimum, Q1, median (Q2), Q3, and maximum, is explained as a foundational tool for understanding data distribution, using an example of Verizon airport data speeds to illustrate the process.
Takeaways
- 📊 Quartiles divide a data set into four groups, each containing approximately 25% of the values.
- 📈 The first quartile (Q1) is the same as the 25th percentile, separating the bottom 25% from the top 75%.
- ⚖️ The second quartile (Q2) is the median, separating the data into two equal halves.
- 📉 The third quartile (Q3) is the 75th percentile, separating the bottom 75% from the top 25%.
- 🔄 Different methods and software can yield slightly different quartile values, but they are generally close.
- 🔢 The five-number summary includes the minimum, Q1, median (Q2), Q3, and the maximum.
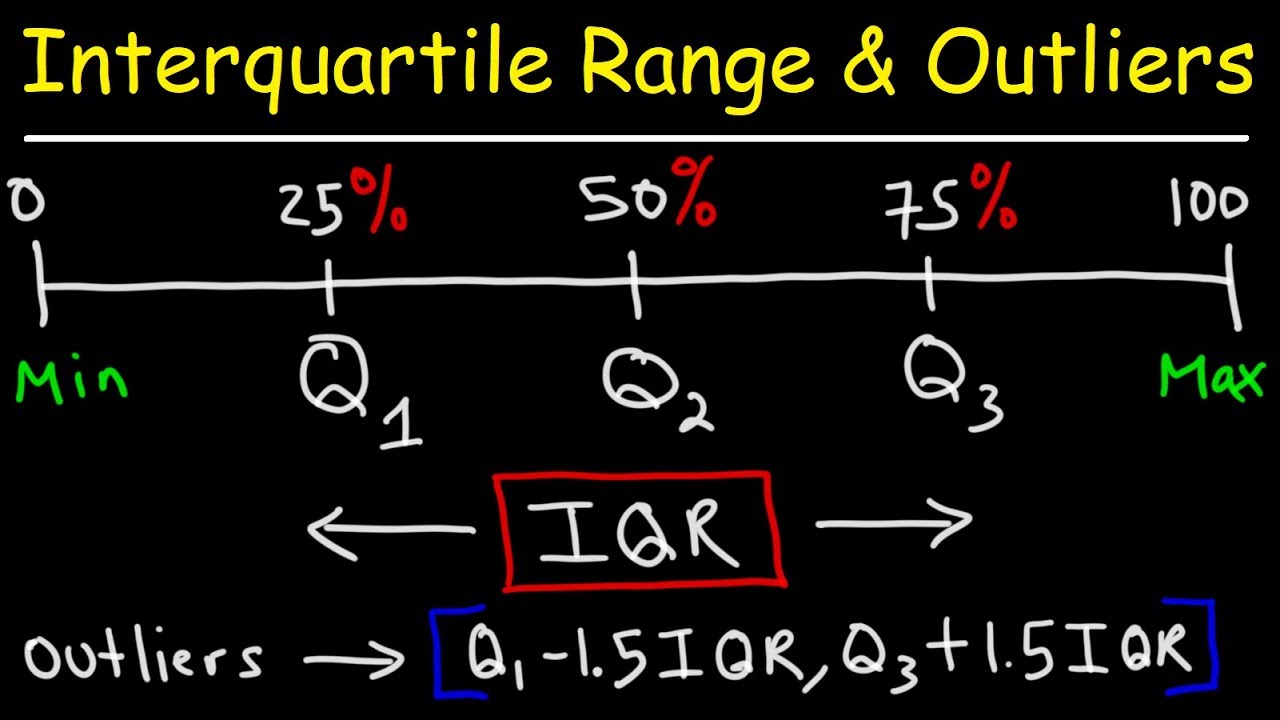
- 🧮 The interquartile range (IQR) is the difference between Q3 and Q1, indicating the range of the middle 50% of the data.
- 📏 The semi-interquartile range is half of the IQR.
- ⚖️ The mid-quartile range is the mean of Q1 and Q3.
- 📐 The 10-90 quartile range is the difference between the 90th percentile and the 10th percentile.
- 📉 The five-number summary is useful for summarizing the distribution of data and is the basis for creating box plots.
- 📊 To find quartiles, the data must be sorted, and then specific locators are used to determine the quartile values.
- 📊 Box plots visually represent the five-number summary and the distribution of data.
Q & A
What is the main topic of the video?
-The main topic of the video is about computing quartiles and the five number summary for a given dataset.
What are quartiles in the context of statistics?
-Quartiles are specific percentiles that divide a dataset into four groups, with each group containing approximately 25% of the values. They are denoted by Q1, Q2, and Q3.
What is the significance of the second quartile in a dataset?
-The second quartile, also known as the median (Q2), separates the top 50% of the data from the bottom 50%, providing a central value for the dataset.
Why might different software or programs give different values for quartiles?
-Different software or programs might give different values for quartiles due to the lack of a consistent method for calculating percentiles and quartiles.
What is the five number summary in statistics?
-The five number summary is a set of five values that summarize the dataset, including the minimum value, the first quartile (Q1), the second quartile (Q2, also the median), the third quartile (Q3), and the maximum value.
What is the interquartile range (IQR) and how is it calculated?
-The interquartile range (IQR) is the difference between the third and first quartiles (Q3 - Q1), representing the range from the 25th to the 75th percentile.
What is the semi-interquartile range and how does it relate to the IQR?
-The semi-interquartile range is half of the interquartile range, providing a measure of the spread of the middle 50% of the data.
What is the 10-90 quartile range and how is it different from the IQR?
-The 10-90 quartile range is the difference between the 90th percentile and the 10th percentile, offering a measure of the spread of the data from the 10th to the 90th percentile, which is different from the IQR that focuses on the middle 50%.
How does the five number summary help in understanding the distribution of a dataset?
-The five number summary provides insights into the range, spread, and relative standing of the data values, showing where the bottom 25%, the next 25%, the middle 50%, and the top 25% of the values lie.
How is the locator used in calculating the quartiles for a dataset?
-The locator is used to determine the position within the dataset to find the value for a specific percentile. It is calculated based on the percentile (k) and the total number of data values (n), and is used to find the approximate position for Q1, Q2, and Q3.
What is the process for finding the first quartile (Q1) in a sorted dataset?
-To find the first quartile (Q1), calculate the locator using the formula (k/100) * n, where k is the percentile (25 for Q1) and n is the number of data values. If the locator is not a whole number, round up to the nearest whole number and use that position in the sorted dataset.
How is the median calculated in the context of the second quartile (Q2)?
-The median, which is the same as the second quartile (Q2), is calculated by taking the mean of the middle two values if the dataset has an even number of values. If the locator is a whole number, take the value at that position and the next one, and calculate their mean.
What steps are involved in finding the third quartile (Q3) in a sorted dataset?
-To find the third quartile (Q3), calculate the locator using the formula (75/100) * n. If the locator is not a whole number, round up to find the position in the sorted dataset that corresponds to the 75th percentile.
How does the video script illustrate the process of calculating a five number summary for a dataset?
-The script provides a step-by-step example using the Verizon airport data speeds, showing how to find the minimum, maximum, first quartile, second quartile (median), and third quartile to create the five number summary.
Outlines
📊 Understanding Quartiles and Five Number Summary
This paragraph introduces the concept of quartiles and the five number summary in the context of data analysis. Quartiles are specific percentiles (q1, q2, q3) that divide a dataset into four parts, with approximately 25% of the values in each segment. The first quartile (q1) is the 25th percentile, separating the lowest 25% of data from the rest. The second quartile (q2), also known as the median, divides the data into 50% on each side. The third quartile (q3) is the 75th percentile, separating the lowest 75% from the top 25%. The paragraph also discusses the variability in the calculation of quartiles due to different methods used by various software or programs. The five number summary, consisting of the minimum, q1, median (q2), q3, and maximum, is highlighted as a way to summarize the distribution of data. Additionally, the paragraph touches on other statistics derived from quartiles, such as the interquartile range, semi-interquartile range, and the 10-90 quartile range, emphasizing their importance in data analysis.
📈 Calculating the Five Number Summary with an Example
The second paragraph provides a step-by-step guide on calculating the five number summary using the Verizon airport data speeds as an example. It starts by explaining the process of finding the minimum and maximum values from a sorted dataset. The calculation of the first quartile (25th percentile) involves determining a 'locator' value, which in this case is 12.5, and rounding up to the nearest whole number, resulting in the 13th value in the dataset being the first quartile. For the median, which is the second quartile (50th percentile), the process involves taking the mean of the 25th and 26th values if the dataset size is even, resulting in the 13.9 megabit per second value. The third quartile (75th percentile) is calculated similarly, with the locator value being 37.5, which is rounded up to 38, indicating the 38th value as the third quartile. The paragraph concludes with the five number summary for the dataset: 0.8, 7.9, 13.9, 21.5, and 77.8 megabits per second, illustrating the distribution and spread of the data values.
📉 Interpreting the Five Number Summary and Upcoming Box Plots
The final paragraph delves into the interpretation of the five number summary, emphasizing how it provides insights into the distribution of data values. It explains the significance of each part of the summary, from the minimum to the maximum, and how the quartiles (q1, q2, q3) reveal the spread of data values within different segments. The paragraph also mentions that these values will be visually represented in the next video about box plots, which will provide a clearer understanding of the data's distribution. The summary concludes with a reiteration of the five number summary values, showing the range and relative standing of the data values within the dataset.
Mindmap
Keywords
💡Quartiles
💡Five Number Summary
💡Percentiles
💡Interquartile Range (IQR)
💡Semi-Interquartile Range
💡Mid Quartile Range
💡10-90 Quartile Range
💡Percentile Value
💡Box Plots
💡Data Distribution
💡Locator
Highlights
Quartiles are specific percentiles that divide a dataset into four groups, with approximately 25% of values in each group.
The first quartile (Q1) is the same as the 25th percentile, separating the bottom 25% from the top 75% of the data.
The second quartile (Q2), also known as the median, separates the top 50% from the bottom 50% of the data.
The third quartile (Q3) separates the bottom 75% from the top 25%, and is equivalent to the 75th percentile.
Different software or programs may calculate quartiles differently, leading to variations in results.
A visual graph can show the distribution of quartiles but may not accurately represent their spacing.
Interquartile range (IQR) is the difference between the third and first quartiles, representing the middle 50% of data values.
Semi-interquartile range is half of the IQR, indicating variability within the central 50% of data.
Mid quartile range is the mean of the first and third quartiles, not necessarily the 50th percentile.
The 10-90 quartile range is the difference between the 90th and 10th percentiles, showing dispersion at the extremes.
Percentiles and quartiles are not to be confused with the actual data values at those positions.
A five-number summary includes the minimum, first quartile, second quartile (median), third quartile, and maximum values.
The five-number summary is foundational for creating box plots, a graphical representation of data distribution.
To calculate quartiles, one must find the 'locator', which determines the position within the dataset to evaluate.
If the locator is a non-whole number, the value is rounded up to determine the position for quartile calculation.
The median, or second quartile, is calculated by averaging the middle two values in an even-numbered dataset.
The third quartile is found by rounding up the locator to the nearest whole number and selecting the value at that position.
An example using Verizon airport data speeds demonstrates the calculation of a five-number summary.
The five-number summary for the example dataset is 0.8, 7.9, 13.9, 21.5, and 77.8 megabits per second.
The five-number summary provides insights into the distribution and variation of data values within a dataset.
Transcripts
Browse More Related Video

How To Make Box and Whisker Plots

Statistics: Quartiles of Grouped Data
How To Find The Interquartile Range & any Outliers - Descriptive Statistics
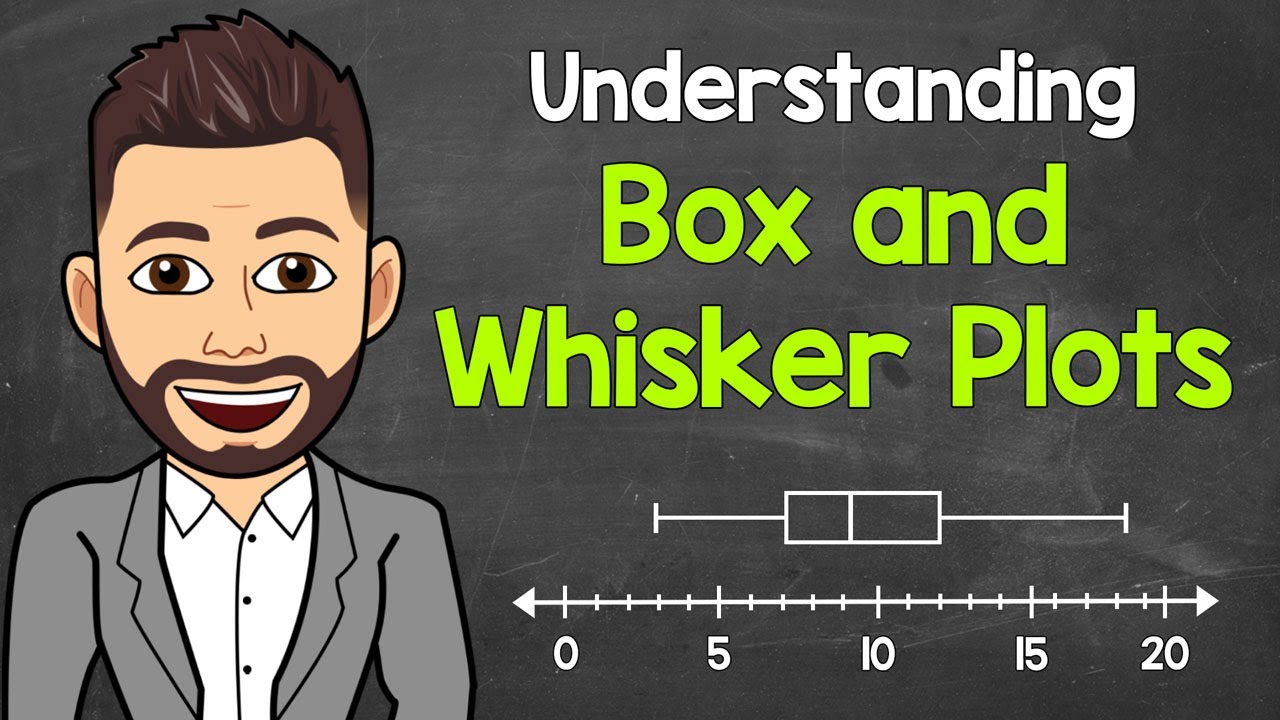
Box and Whisker Plots Explained | Understanding Box and Whisker Plots (Box Plots) | Math with Mr. J
3.3.4 Measures of Relative Standing - Boxplots and Modified Boxplots
Understanding Standard deviation and other measures of spread in statistics
5.0 / 5 (0 votes)
Thanks for rating: