Statistics: Quartiles of Grouped Data
TLDRThis tutorial offers an insightful guide on statistics, focusing on the calculation of quartiles for grouped data. It explains how to determine the lower quartile (Q1), upper quartile (Q3), interquartile range, and semi-interquartile range using specific formulas and a step-by-step approach with a sample problem. The video demonstrates the process of finding class boundaries, cumulative frequencies, and applying these to calculate the quartiles, providing a clear understanding of statistical analysis for grouped data.
Takeaways
- 📊 The tutorial focuses on the calculation of statistics for grouped data, specifically upper and lower quartiles, interquartile range, and semi-interquartile range.
- 🔢 The formula for the lower quartile (Q1) is given as Q1 = L + (n/4 - FC) / Fq * W, where L is the lower class boundary, n is the total frequency, FC is the cumulative frequency before the quartile class, Fq is the frequency of the quartile class, and W is the width of the class interval.
- 📈 The formula for the upper quartile (Q3) is Q3 = L + (3n/4 - FC) / Fq * W, which is similar to Q1 but with adjustments for the upper quartile calculations.
- 📝 Understanding the parameters in the formulas is crucial, including the class interval, cumulative frequency, and class width.
- 📚 The tutorial provides a step-by-step process for calculating the quartiles and ranges using a given data set of applicant marks in a selection test.
- 📉 To find the quartile classes, the cumulative frequency is used to identify where the specific quartile positions fall within the data set.
- 📋 The lower and upper class boundaries are calculated as the average of the lower and upper boundaries of the class intervals.
- 📝 The tutorial demonstrates the calculation of Q3 and Q1 using specific values from the data set, including identifying the correct class intervals and applying the formulas.
- 📊 The interquartile range is calculated by subtracting Q1 from Q3, and the semi-interquartile range is half of the interquartile range.
- 📈 The final calculated values for Q3, Q1, interquartile range, and semi-interquartile range are provided, giving a complete statistical summary of the data set.
- 👍 The tutorial concludes with an invitation to like, share, and subscribe to the YouTube channel for more statistics topics.
Q & A
What is the main topic of this tutorial video?
-The main topic of this tutorial video is the calculation of quartiles for grouped data, specifically focusing on upper quartile (Q3), lower quartile (Q1), interquartile range, and semi-interquartile range.
What is the formula for calculating the lower quartile (Q1) in grouped data?
-The formula for calculating the lower quartile (Q1) is Q1 = L + (n/4 - FC) / Fq * W, where L is the lower class boundary of the quartile class, n is the total frequency, FC is the cumulative frequency before the quartile class, Fq is the frequency of the quartile class, and W is the width of the class interval.
How is the upper quartile (Q3) calculated in the context of this tutorial?
-The upper quartile (Q3) is calculated using the formula Q3 = L + (3n/4 - FC) / Fq * W, which is similar to Q1 but with (3n/4) instead of (n/4) in the formula.
What does the term 'interquartile range' represent in statistics?
-The interquartile range (IQR) represents the difference between the upper quartile (Q3) and the lower quartile (Q1), providing a measure of statistical dispersion and is a way to describe the spread of the middle 50% of the data.
What is the formula for calculating the semi-interquartile range?
-The semi-interquartile range is calculated as half of the interquartile range, which is (Q3 - Q1) / 2.
How is the cumulative frequency used in the calculation of quartiles?
-The cumulative frequency is used to identify the class interval that contains the point of interest (n/4 for Q1 and 3n/4 for Q3), which helps in determining the lower class boundary (L) and the frequency (Fq) of the quartile class.
What is the purpose of calculating the lower and upper class boundaries?
-The lower and upper class boundaries are used to determine the specific class interval that contains the data points corresponding to the quartiles, which is essential for calculating Q1 and Q3 accurately.
How do you find the class interval that contains the 75th percentile (upper quartile)?
-You calculate 3n/4, where n is the total number of observations. In this script, 3n/4 is calculated as 75. You then find the class interval in the cumulative frequency table that contains the 75th data point.
What is the significance of the class width (W) in the calculation of quartiles?
-The class width (W) is used in the calculation to adjust the quartile value to the exact point within the class interval that corresponds to the desired percentile. It's especially important when the quartile does not fall exactly on a data point.
Can the method demonstrated in the script be applied to data that is not grouped?
-The method demonstrated in the script is specifically for grouped data. For ungrouped data, the calculation of quartiles would be different and would not require the determination of class intervals or cumulative frequencies.
Outlines
📊 Introduction to Calculating Quartiles and Ranges
This paragraph introduces the tutorial on statistics, focusing on the analysis of grouped data. It outlines the concepts of upper and lower quartiles, interquartile range, and semi-interquartile range. The formulas for calculating these statistical measures are presented, along with an explanation of the parameters involved: lower class boundary (L), total frequency (n), cumulative frequency (FC), frequency of the quartile class (fq), and class width (W). The tutorial then proceeds to apply these formulas to a problem involving the marks of applicants in a selection test, demonstrating how to calculate the necessary parameters and understand the data structure.
🔍 Detailed Calculation of Upper Quartile (Q3)
The second paragraph delves into the process of calculating the upper quartile (Q3) using the provided formula. It explains how to identify the upper quartile class interval by finding 3n/4 from the total frequency (n), which in this case is 100. The paragraph guides through the steps of determining the lower class boundary (L), cumulative frequency (FC) before the quartile class, frequency of the quartile class (fq), and class width (W). The calculation is performed to find Q3, which represents the value below which the top 25% of the data falls, concluding with the upper quartile being 54.5 for the given distribution.
📐 Calculation of Lower Quartile (Q1), Interquartile, and Semi-Interquartile Ranges
The final paragraph continues the statistical analysis by calculating the lower quartile (Q1) using a similar method to Q3 but with n/4 instead. It identifies the lower quartile class interval and calculates Q1, which is the value below which the bottom 25% of the data falls, resulting in 36.69. Following this, the interquartile range (IQR) is determined by subtracting Q1 from Q3, yielding a measure of the spread of the middle 50% of the data. The semi-interquartile range, which is half of the IQR, is also calculated, providing a measure of variability within the central region of the data. The paragraph concludes with the final values for IQR (17.81) and semi-interquartile range (8.95), summarizing the statistical analysis of the applicants' marks.
Mindmap
Keywords
💡Quartile
💡Lower Quartile (Q1)
💡Upper Quartile (Q3)
💡Interquartile Range (IQR)
💡Semi-Interquartile Range
💡Cumulative Frequency
💡Class Interval
💡Frequency
💡Lower Class Boundary
💡Width
💡Data Distribution
Highlights
Introduction to the tutorial on statistics focusing on quartiles for grouped data.
Explanation of how to calculate the lower quartile (Q1) using the formula Q1 = L + (n/4 - FC) / FQ * W.
Description of the parameters involved in the Q1 formula: L, n, FC, FQ, and W.
Formula for calculating the upper quartile (Q3) with Q3 = L + (3n/4 - FC) / FQ * W.
Clarification on the meaning of L as the lower class boundary for quartile classes.
The total frequency of the distribution (n) is the sum of all frequencies.
FC represents the cumulative frequency before the quartile class.
FQ is the frequency of the quartile class itself.
W is the width of the class interval, essential for calculating quartiles.
Interquartile range (IQR) is defined as the difference between Q3 and Q1.
Semi-interquartile range is half of the interquartile range, calculated as (Q3 - Q1) / 2.
Demonstration of how to calculate quartiles using a table of applicant marks from a selection test.
Process of creating cumulative frequency and lower class boundaries for quartile calculation.
Identification of the upper quartile class interval by finding 3n/4 in the cumulative frequency.
Calculation of Q3 using the identified parameters for the upper quartile class.
Determination of the lower quartile class interval by locating n/4 in the cumulative frequency.
Calculation of Q1 using the identified parameters for the lower quartile class.
Final calculation of the interquartile range and semi-interquartile range for the given data set.
Conclusion of the tutorial with a summary of the calculated quartiles and ranges.
Transcripts
Browse More Related Video
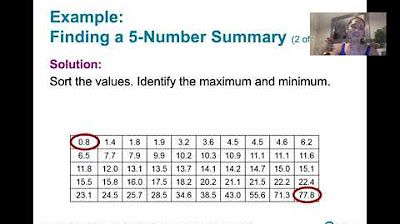
3.3.3 Measures of Relative Standing and Boxplots - Quartiles and the 5 Number Summary
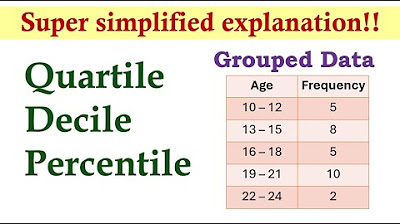
Measures of Position (Grouped Data) | Basic Statistics

How To Make Box and Whisker Plots
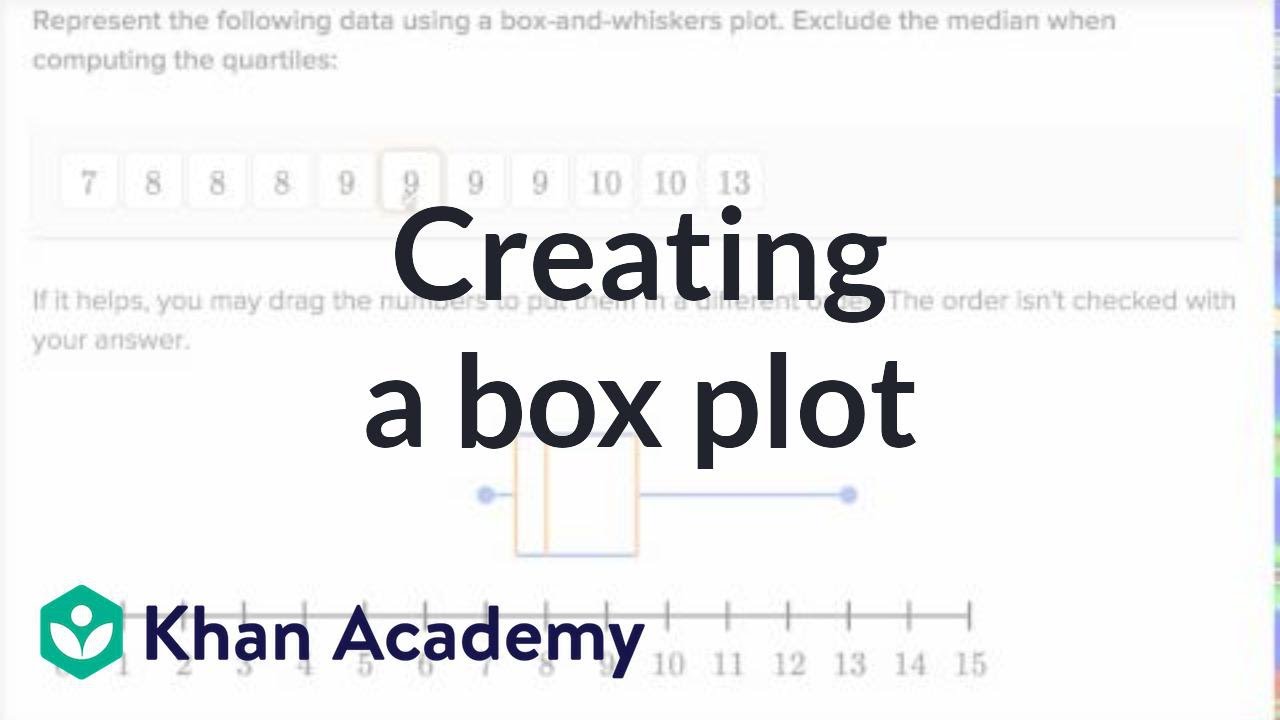
Box and whisker plot exercise example | Data and statistics | 6th grade | Khan Academy
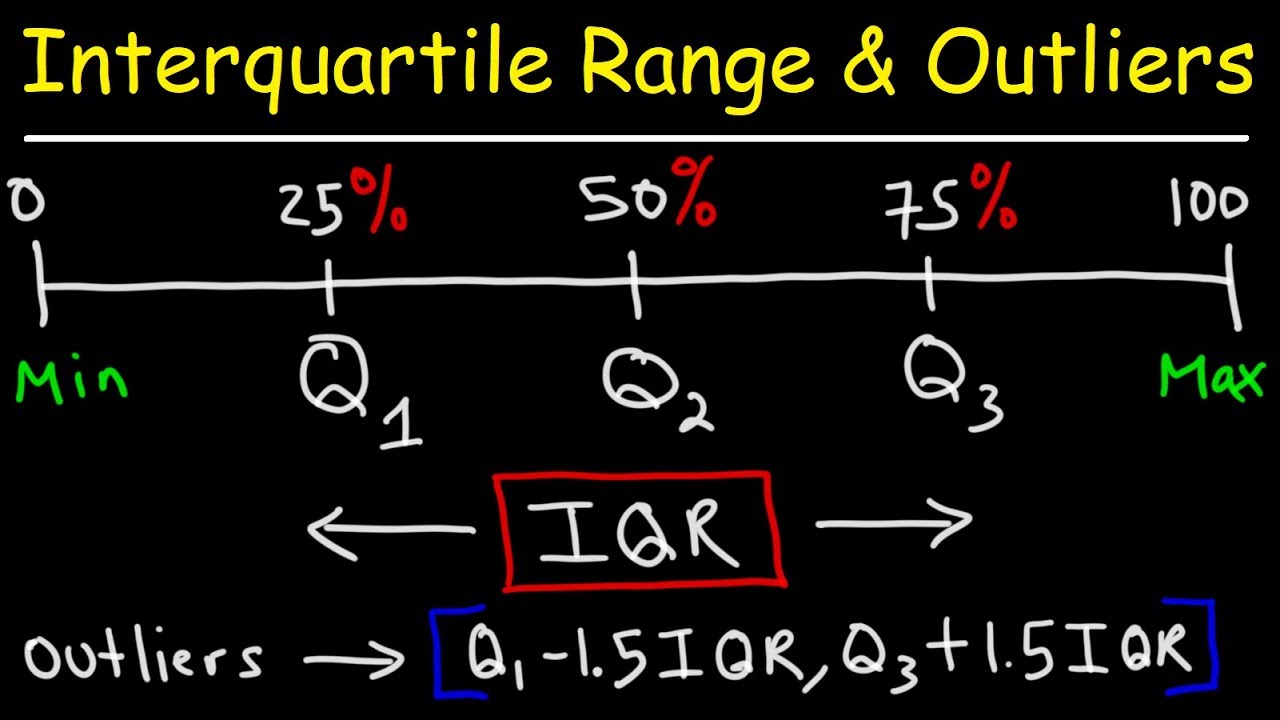
How To Find The Interquartile Range & any Outliers - Descriptive Statistics
Measures of Position (Ungrouped Data) | Basic Statistics
5.0 / 5 (0 votes)
Thanks for rating: