How To Find The Interquartile Range & any Outliers - Descriptive Statistics
TLDRThis lesson explains how to calculate the interquartile range (IQR) and identify outliers given a data set. It first overviews key terms: the data range between min and max values, median as the middle number dividing data in half, quartiles splitting data into four parts. It then walks through finding quartiles by dividing data subsets, using their difference to get the IQR representing middle 50%. Finally, it defines outliers as outside 1.5 x IQR below Q1 or above Q3, provides data sets to exemplify calculating IQR and pinpointing outlier numbers, imparting a clear process to summarize middle data tendencies and detect extreme values.
Takeaways
- 😀 To find the interquartile range (IQR), take the difference between the 3rd quartile (Q3) and 1st quartile (Q1).
- 📏 Q1 represents the 25th percentile and Q3 represents the 75th percentile.
- 📈 Arrange the data in ascending order before calculating the quartiles.
- 🎯 The median splits the data into equal lower and upper halves to find Q1 and Q3.
- 🔢 Calculate Q2 first by finding the overall median of the entire dataset.
- ❗ Outliers exist outside the range of Q1 - 1.5*IQR to Q3 + 1.5*IQR.
- 📉 Numbers less than Q1 - 1.5*IQR are lower outliers.
- 📈 Numbers greater than Q3 + 1.5*IQR are upper outliers.
- 🎯 Check if any data points fall outside the outlier boundaries.
- 📊 Understanding quartiles and outliers helps analyze the spread of data.
Q & A
What does the interquartile range (IQR) represent?
-The IQR represents the middle 50% of the data. It is the difference between the third quartile (Q3) and the first quartile (Q1).
How do you calculate the first and third quartiles?
-To find Q1, take the median of the lower half of the ordered data set. To find Q3, take the median of the upper half of the ordered data set.
What do the quartiles signify?
-The quartiles divide the ordered data set into four equal parts. Q1 represents the 25th percentile and Q3 represents the 75th percentile.
What is the criteria for determining if a data point is an outlier?
-A data point is considered an outlier if it falls outside the range of: Q1 - 1.5*IQR to Q3 + 1.5*IQR.
Why do we need to arrange the data in ascending order first?
-Arranging the data from lowest to highest value allows us to clearly see the distribution and easily identify the median and quartiles.
What is the significance of Q2?
-Q2 represents the median or 50th percentile, splitting the ordered data set into equal lower and upper halves.
What does a number line diagram depict?
-A number line diagram visually shows the minimum and maximum values in a data set, highlighting the key statistical measures like median, quartiles, and potential outliers.
Why identify and exclude outliers?
-Outliers are data points that skew statistical analysis. Identifying and excluding them allows for a more accurate understanding of the overall distribution.
What is the first step in calculating quartiles and IQR?
-The first step is to order the entire data set in numerical order from smallest to largest value.
Can a data set have more than one outlier?
-Yes, it is possible for a data set to have multiple outlier values that fall outside the Q1 - 1.5*IQR to Q3 + 1.5*IQR range.
Outlines
📝 Taking notes on interquartile range and outliers
This paragraph explains how to visualize data distribution using a number line diagram. It defines key terms like median, quartiles (Q1 - first quartile, Q2 - second quartile/median, Q3 - third quartile), interquartile range (IQR) which represents the middle 50% of data, and outliers which are data points outside the expected range.
📏 Calculating IQR and identifying outliers
This paragraph walks through an example data set to demonstrate calculation of interquartile range (IQR) as the difference between Q3 and Q1. It also explains how to determine if a data point is an outlier using the criteria of being outside the range of Q1 - 1.5*IQR to Q3 + 1.5*IQR.
🗂️ Organizing data and calculating quartiles
This paragraph provides a second example data set to practice skills on arranging data in order, calculating quartiles Q1, Q2 and Q3 by splitting data into equal parts, determining interquartile range (IQR), and using IQR to identify potential outliers in the data.
Mindmap
Keywords
💡interquartile range
💡outlier
💡quartile
💡percentile
💡median
💡lower/upper half
💡ascending order
💡interval
💡IQR fences
💡two equal parts
Highlights
The median splits the data into equal lower and upper halves
Q1 represents the 25th percentile, Q2 the 50th percentile, and Q3 the 75th percentile
IQR represents the middle 50% of the data and is calculated as Q3 - Q1
Outliers exist outside the range of Q1 - 1.5*IQR to Q3 + 1.5*IQR
To find outliers, arrange data in ascending order and calculate Q1, Q2, Q3 and IQR
Average two middle numbers if there are an even number of data points to find a quartile
A data point outside the Q1 - 1.5*IQR to Q3 + 1.5*IQR range is an outlier
Quartiles divide the ordered data set into four equal parts
Q1 is the median of the lower half and Q3 the median of the upper half
Determine if numbers are outliers by seeing if they are outside the calculated range
Extreme values at ends of range can indicate outliers
Calculate Q1 by finding median of lower half after ordering numbers
Calculate Q3 by finding median of upper half after ordering numbers
Subtract Q1 from Q3 to get the interquartile range (IQR)
Numbers outside the calculated range using 1.5*IQR are outliers
Transcripts
Browse More Related Video

How To Make Box and Whisker Plots
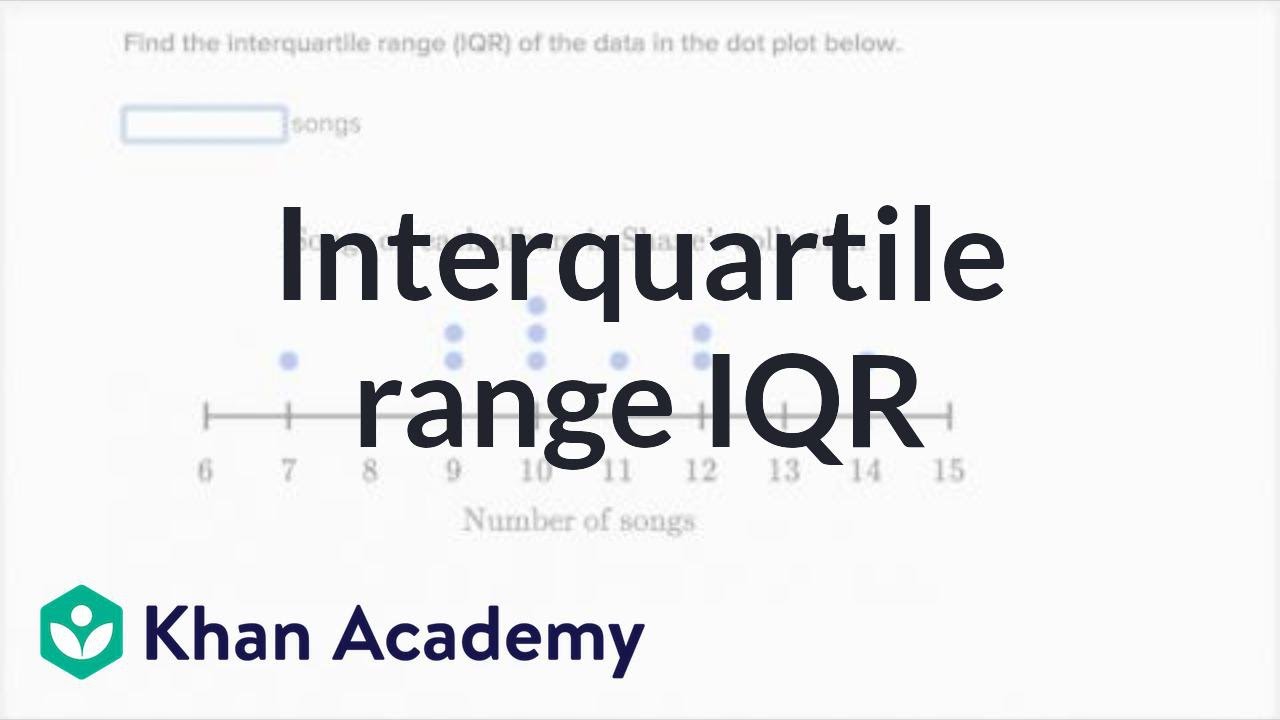
How to calculate interquartile range IQR | Data and statistics | 6th grade | Khan Academy
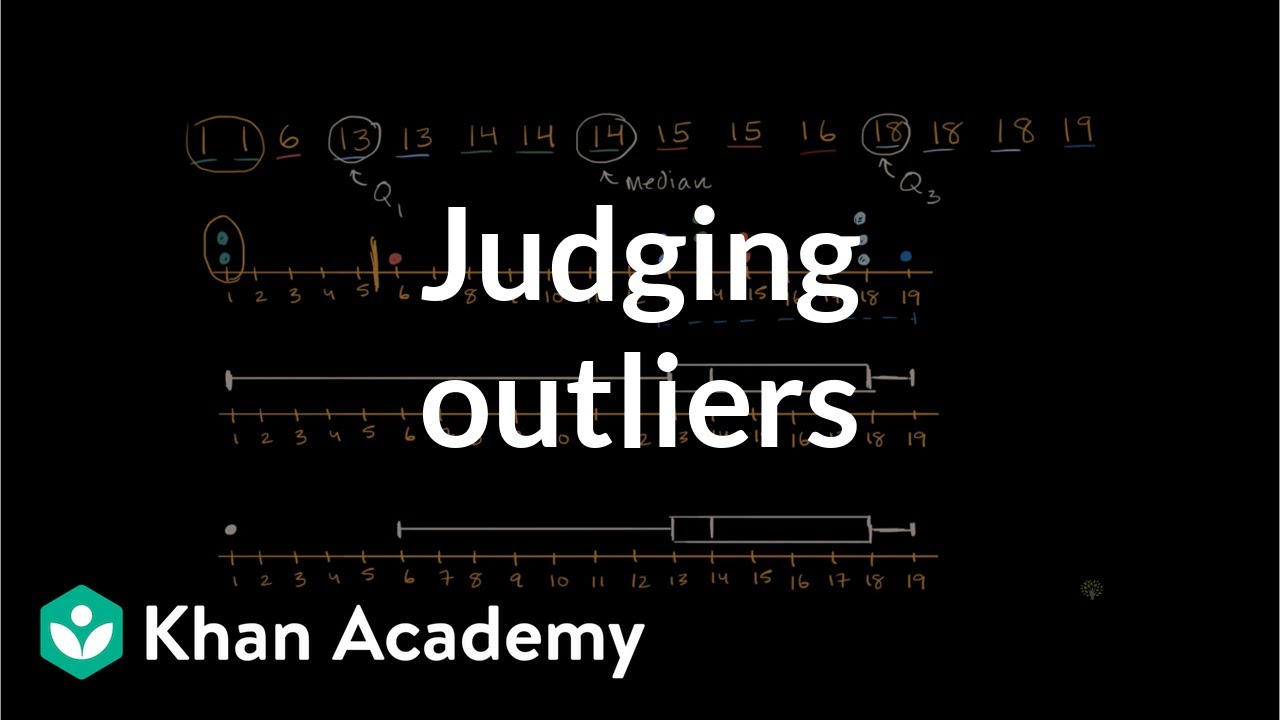
Judging outliers in a dataset | Summarizing quantitative data | AP Statistics | Khan Academy
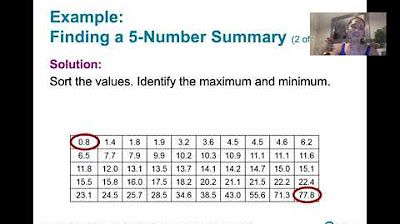
3.3.3 Measures of Relative Standing and Boxplots - Quartiles and the 5 Number Summary

Range | Interquartile Range (IQR) | Box and whisker plot
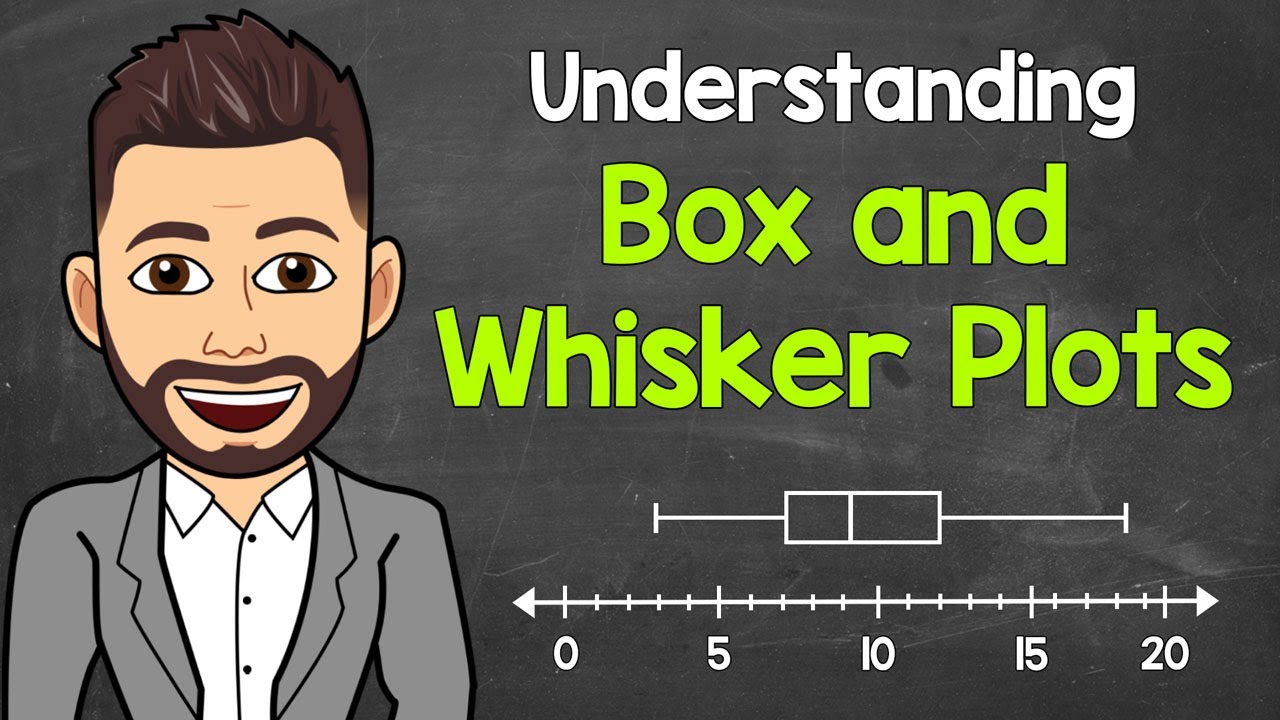
Box and Whisker Plots Explained | Understanding Box and Whisker Plots (Box Plots) | Math with Mr. J
5.0 / 5 (0 votes)
Thanks for rating: