Confidence intervals and margin of error | AP Statistics | Khan Academy
TLDRThe video script discusses the concept of estimating the likelihood of a candidate's victory in an election using polling. It explains that instead of surveying the entire population, statisticians sample a smaller group to calculate the sample proportion supporting the candidate. The script introduces the idea of a confidence interval, which estimates the range of the true population proportion with a certain level of confidence. It also touches on the concept of standard error and how increasing the sample size can reduce the margin of error, leading to more precise estimates.
Takeaways
- 📊 In election polling, determining the likelihood of a candidate's victory involves estimating the population proportion from a sample.
- 🌐 It's impractical to survey every potential voter, so statisticians use sampling to estimate the population parameter.
- 🔢 The sample size and proportion are crucial in estimating the population proportion and creating a confidence interval.
- 🏆 Candidate A's victory probability is estimated by sampling and calculating the sample proportion in support of A.
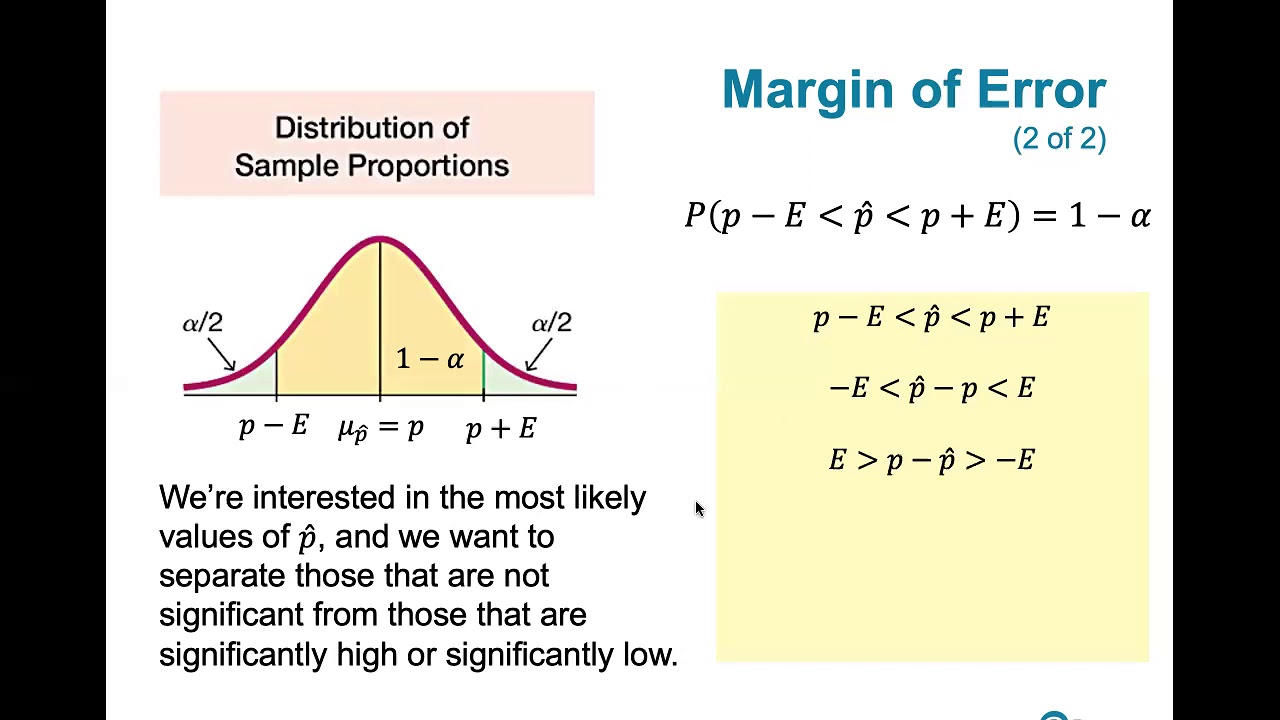
- 📈 The sampling distribution of the sample proportions is introduced as a normal distribution when the sample size is large.
- 🎯 The mean of the sampling distribution is the true population proportion, which is the value we aim to estimate.
- 📉 The standard deviation of the sampling distribution, also known as the standard error, is calculated using the formula √(p*(1-p)/n), where p is the sample proportion and n is the sample size.
- 🔍 A 95% confidence interval is created by looking within two standard deviations of the sample proportion, which covers the true population proportion 95% of the time.
- 🔎 The margin of error is defined as two times the standard error and gives the range where the true population proportion is likely to fall.
- 📊 Increasing the sample size reduces the margin of error and improves the precision of the confidence interval.
- 🤔 The true population proportion is unknown, so we rely on the sample proportion as the best estimate for statistical analysis.
- 📝 Confidence intervals are a key tool in inferential statistics, providing a range of values within which the population parameter is likely to be found.
Q & A
What is the main objective of the pollsters during the election season?
-The main objective of the pollsters is to determine the likelihood of a candidate winning the election by estimating the population proportion of likely voters who support the candidate.
Why is it not practical to survey the entire population of likely voters?
-It is not practical due to the large number of likely voters, which could be as high as 100,000 or more. Surveying such a large population would be time-consuming and resource-intensive.
What is the alternative to surveying the entire population?
-The alternative is to sample a smaller, representative portion of the population and use the sample to estimate the population parameter, which in this case is the proportion of voters supporting a particular candidate.
What is the sample size used in the example provided in the script?
-The sample size used in the example is 100 likely voters.
What was the sample proportion of voters supporting candidate A in the example?
-In the example, 54 out of the 100 sampled voters supported candidate A, resulting in a sample proportion of 0.54.
Why might the sample proportion vary between different samples?
-The sample proportion might vary because each sample is randomly selected, and different samples may contain different subsets of the population, leading to different outcomes.
What is the significance of the sampling distribution of sample proportions?
-The sampling distribution of sample proportions is significant because it helps us understand the variability and likelihood of different sample proportions. It is used to estimate the population proportion and construct confidence intervals.
What assumptions are made about the sampling distribution of sample proportions?
-The assumptions are that each person's response is approximately independent and that the true population proportion is not too close to zero or one, allowing the sampling distribution to be approximately normal.
What is the formula for the standard deviation of the sampling distribution of sample proportions?
-The standard deviation, also known as the standard error, is calculated as the square root of (p * (1 - p)) divided by the sample size, n.
What is the relationship between the sample proportion and the population proportion in the context of confidence intervals?
-The sample proportion is used to estimate the population proportion. With a 95% confidence level, there is a 95% probability that the population proportion lies within two standard deviations of the sample proportion.
How can the margin of error be reduced?
-The margin of error can be reduced by increasing the sample size, which in turn decreases the standard error of the sampling distribution.
What is the confidence interval and how is it used in polling?
-The confidence interval is a range that is expected to contain the true population proportion with a certain level of confidence, typically 95%. It is calculated by adding and subtracting the margin of error from the sample proportion.
Outlines
📊 Understanding Election Polling and Sampling Distributions
This paragraph discusses the process of election polling during an election season where there is a runoff between two candidates. It explains the impracticality of surveying the entire population of likely voters and the statistical alternative of sampling. The instructor introduces the concept of a sampling distribution, which is used to estimate the population proportion that supports a particular candidate. The distribution is described as normal, with the mean being the actual population proportion and the standard deviation derived from a formula involving the sample proportion and sample size. The paragraph emphasizes the uncertainty in sampling and the tools available in statistics to understand the distribution of possible sample proportions.
🔍 Interpreting Sample Proportions and Confidence Intervals
The second paragraph delves into the interpretation of sample proportions and the construction of confidence intervals. It explains that a 95% confidence level means that 95% of the time, the sample proportion will be within two standard deviations of the true population proportion. The paragraph introduces the concept of standard error as an estimate for the population proportion when the true value is unknown. It then describes how to calculate a confidence interval using the sample proportion and standard error, providing an example with specific numbers. The concept of margin of error is also introduced, which is related to the confidence interval and depends on the sample proportion and sample size.
📈 Margin of Error and Sample Size Impact
In the final paragraph, the discussion focuses on the margin of error and its relationship with sample size. It explains that the margin of error is not fixed and varies depending on the sample proportion. The method used to calculate the confidence interval is emphasized as a way to include the true population proportion in the calculated interval 95% of the time. The paragraph also addresses the question of how to tighten up the intervals on average, suggesting that increasing the sample size is the best way to reduce the margin of error. The importance of sampling more people for a lower margin of error in election coverage is highlighted.
Mindmap
Keywords
💡Election Season
💡Pollsters
💡Population Proportion
💡Sample
💡Sample Proportion
💡Sampling Distribution
💡Standard Deviation
💡Confidence Interval
💡Margin of Error
💡Standard Error
Highlights
The introduction of the concept of estimating the likelihood of a candidate's victory in an election using polling methods.
The explanation of why it is impractical to survey every likely voter and the necessity of sampling in statistics.
The calculation of the sample proportion and its role in estimating the population proportion.
The concept of sampling distribution and how it can be used to understand the variability of sample proportions.
The assumption of approximate independence among sampled individuals and the implications for the sampling distribution's shape.
The use of the normal distribution as an approximation for the sampling distribution under certain conditions.
The formula for the standard deviation of the sampling distribution and its components.
The idea that the sample proportion can be used to estimate the population proportion with a certain level of confidence.
The definition and calculation of the standard error as an estimate for the population proportion.
The concept of a confidence interval and how it is constructed using the sample proportion and standard error.
The interpretation of the confidence interval as an estimate of the true population proportion.
The explanation of the margin of error and its relationship with the confidence interval.
The insight that increasing the sample size reduces the margin of error, leading to tighter confidence intervals.
The practical application of these statistical concepts in the context of election polling.
The discussion on the importance of sampling in achieving accurate and reliable statistical estimates.
The emphasis on the iterative nature of statistical methods and their reliability in capturing the true population parameter over time.
Transcripts
Browse More Related Video

Elementary Stats Lesson #15

Confidence Interval for a population proportion | Solved Problems
7.1.4 Estimating a Population Proportion - Margin of Error and Computing Confidence Intervals
7.1.6 Estimating a Pop. Proportion - The Right Sample Size for a Given Error and Confidence Level

Math 119 Chap 7 part 1
Survey Margin of Error: What is it? How does it relate to sample size?
5.0 / 5 (0 votes)
Thanks for rating: