Percentiles and Quartiles
TLDRIn this lecture, the concept of organizing data into percentiles, quartiles, and percentages is explained. The lecturer begins by defining percentages and providing an example with a simple data set. They then introduce percentiles, illustrating how to calculate the percentile rank of a given value. The concept of quartiles is also discussed, explaining how data is divided into quartiles representing different percentile rankings. The lecture provides clear definitions and examples to help understand these statistical measures.
Takeaways
- 🔢 A percentage is calculated by dividing the number of observations with a certain characteristic by the total number of observations and multiplying by 100.
- 📊 A percentile represents a value below which a certain percentage of observations fall.
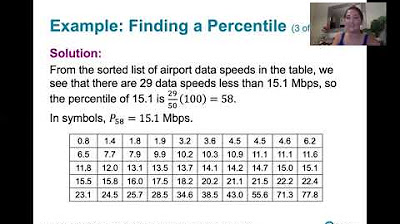
- 📈 To find a percentile ranking, divide the number of values below a certain value by the total number of values in the dataset, then multiply by 100.
- 🧩 If a percentile calculation results in a non-whole number, the value at that percentile is the average of the two surrounding data points.
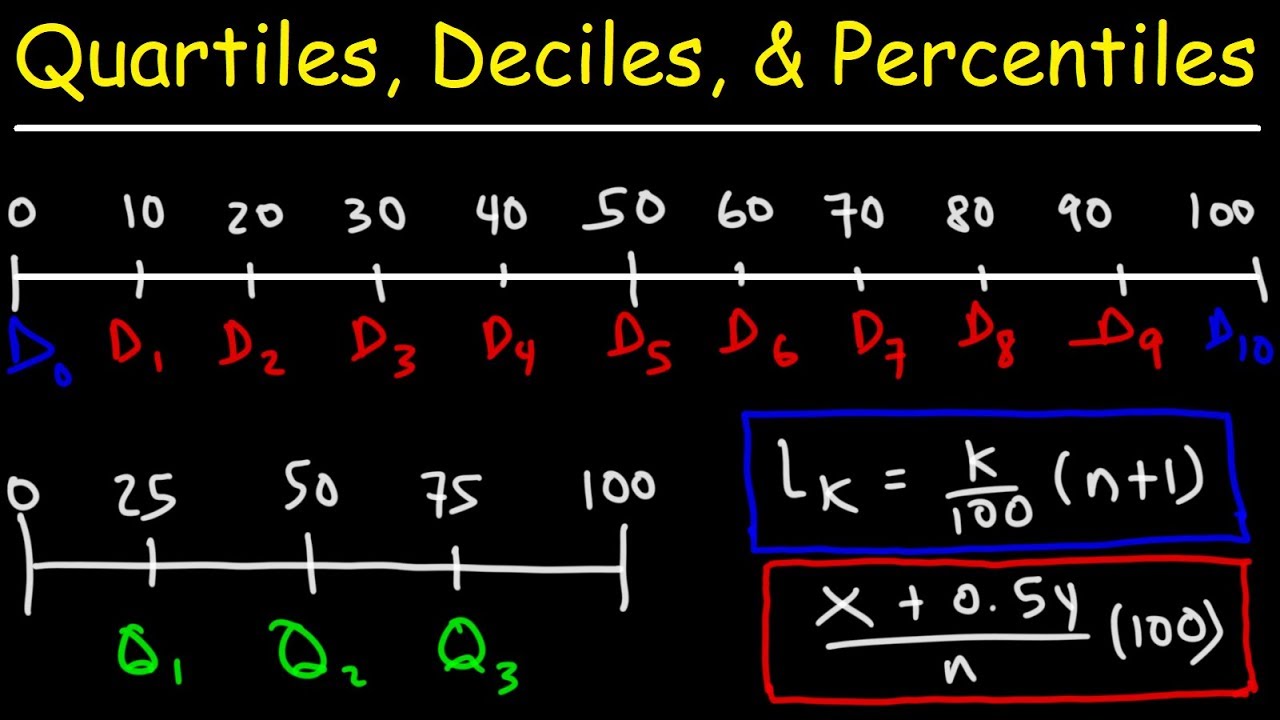
- 📚 The 25th percentile is calculated by taking the value of the percentile (25 in this case), dividing by 100, multiplying by the total number of observations plus one.
- 📝 Quartiles divide a data set into four equal parts, with the first quartile at the 25th percentile, the second at the 50th, and the third at the 75th.
- 📋 The first quartile (Q1) represents the median of the lower half of the data set, the third quartile (Q3) represents the median of the upper half.
- 📉 The interquartile range (IQR) is the difference between the third and first quartiles, which provides a measure of statistical dispersion.
- 📊 Percentiles and quartiles are useful for understanding the distribution of data and identifying outliers.
- 📐 The script provides a practical example of how to calculate percentiles and understand quartiles using a simple dataset.
- 📝 Understanding percentages, percentiles, and quartiles is essential for data analysis and interpretation.
Q & A
What is the basic concept of a percentage in the context of a dataset?
-A percentage is the number of observations that meet a certain characteristic of interest divided by the total number of observations, multiplied by 100. It represents the proportion of the total that possesses the characteristic of interest.
How do you calculate the percentage of even numbers in a dataset with values 1, 2, 3, 4, and 5?
-You identify the even numbers in the dataset, which are 2 and 4. Then, you divide the count of even numbers (2) by the total number of observations (5) and multiply by 100 to get 40%. This means 40% of the numbers in the dataset are even.
What is a percentile and how is it used to rank a value within a dataset?
-A percentile is a value below which a certain percentage of observations in a dataset fall. It is used to rank a value by determining what percentage of scores in the dataset are lower than that value.
How would you find the percentile ranking of the number 10 in a dataset ranging from 2 to 12?
-You count the number of scores below 10, which in this case are all scores up to 9. Then, you divide that number by the total number of scores in the dataset and multiply by 100 to get the percentile ranking.
What is the equation used to calculate the percentile ranking of a value?
-The percentile ranking of a value is calculated using the formula: (Number of values below the value / Total number of values in the set) * 100.
If you want to find the value that corresponds to a 25th percentile ranking, what formula do you use?
-To find the value at a specific percentile ranking, you use the formula: (Percentile / 100) * (Sample size + 1).
What should you do if the calculated percentile value is not a whole number?
-If the calculated percentile value is not a whole number, you should take the average (mean) of the two closest whole numbers in the dataset to determine the value that corresponds to that percentile ranking.
What is the first quartile in a dataset and how is it represented?
-The first quartile, or Q1, represents the 25th percentile in a dataset. It is the value below which 25% of the data lies and is used to divide the dataset into quarters.
What does the second quartile represent and what percentage does it correspond to?
-The second quartile, or Q2, represents the 50th percentile in a dataset. It corresponds to the median, the value below which 50% of the data lies.
What is the third quartile and how does it relate to the dataset's distribution?
-The third quartile, or Q3, represents the 75th percentile in a dataset. It is the value below which 75% of the data lies and helps to understand the upper quarter of the dataset's distribution.
What is the main takeaway from this lecture on organizing data into percentiles and quartiles?
-The main takeaway is understanding the concepts of percentiles and quartiles, which are essential for summarizing and analyzing the distribution of data in a dataset.
Outlines
📊 Introduction to Data Organization with Percentiles and Quartiles
This paragraph introduces the concepts of organizing data into percentiles and quartiles, starting with a basic example of a dataset and the calculation of percentages. It explains how to determine the percentage of even numbers within a dataset and then moves on to define percentiles as values below which a certain percentage of observations fall. The speaker illustrates the calculation of the percentile ranking for a given value, using a dataset ranging from 2 to 12. The explanation includes the formula for calculating percentile ranking and an example calculation for the 80th percentile. The paragraph concludes with a brief introduction to quartiles, explaining that they represent the 25th, 50th, and 75th percentile rankings, respectively.
Mindmap
Keywords
💡Percentage
💡Data Set
💡Percentile
💡Characteristic of Interest
💡Quartile
💡Observations
💡Ranking
💡Mean
💡Sample Size
💡Median
💡Statistical Measure
Highlights
Introduction to the concept of percentages and their calculation as a proportion of the total observations.
Explanation of how to determine the percentage of even numbers in a dataset.
Definition of a percentile as a value below which a certain percentage of observations fall.
Illustration of calculating the percentile ranking of a specific value using a sample dataset.
Equation for calculating the percentile ranking of any value in a dataset.
Example of determining the percentile rank of the value 10 in a dataset.
Method to work backwards from a percentile to find the corresponding value in a dataset.
Equation to find the value corresponding to a specific percentile ranking.
Explanation of how to handle non-whole number results when calculating percentiles.
Calculation of the value at the 25th percentile using the provided equation.
Discussion on the concept of quartiles and their significance in data organization.
Definition of quartiles as the 25th, 50th, and 75th percentile rankings.
Importance of understanding percentiles, quartiles, and percentages in data analysis.
Practical application of percentiles and quartiles in interpreting data distributions.
Summary of the lecture's key points on organizing data into percentiles and quartiles.
Emphasis on the practicality of understanding statistical measures for data interpretation.
Transcripts
Browse More Related Video
Quartiles, Deciles, & Percentiles With Cumulative Relative Frequency - Data & Statistics
Percentiles, Quantiles and Quartiles in Statistics | Statistics Tutorial | MarinStatsLectures
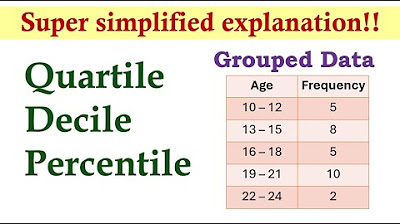
Measures of Position (Grouped Data) | Basic Statistics
Measures of Position (Ungrouped Data) | Basic Statistics
3.3.2 Measures of Relative Standing and Boxplots - Percentiles
3.3.3 Measures of Relative Standing and Boxplots - Quartiles and the 5 Number Summary
5.0 / 5 (0 votes)
Thanks for rating: