Measures of Position (Grouped Data) | Basic Statistics
TLDRThis instructional video script teaches viewers how to calculate various statistical measures for grouped data, such as quartiles, deciles, and percentiles. It explains the process of finding the lower class boundary, cumulative frequency, and class intervals, then applies these to determine the first and third quartiles, as well as the 4th decile and 19th and 96th percentiles. The script provides step-by-step instructions, ensuring a clear understanding of how to interpret and analyze grouped data to derive meaningful statistical insights.
Takeaways
- 📊 The video teaches how to calculate measures of position such as quartiles and percentiles for grouped data.
- 🔢 Grouped data is organized into ranges, like age groups in the example provided.
- 📐 The formula for quartiles is introduced: Q_k = lower class boundary + (K * n / 4) - (lower less than cumulative frequency / frequency of the class interval) * class width.
- 👶 The process of finding the lower class boundary involves subtracting 0.5 from the lower limit of each group.
- 📈 To calculate the less than cumulative frequency, you sum the frequencies of each group starting from the smallest.
- 🎯 The quartile class is determined by multiplying the position (K) by the total frequency (n) and dividing by 4.
- 🔑 For quartiles, when the position falls between two numbers, the larger number is chosen for calculation.
- 📌 The first quartile (Q1) is calculated to be approximately 13.44, indicating that 25% of the data is less than this value.
- 📊 The third quartile (Q3) is calculated to be approximately 19.85, showing that 75% of the data is less than this value.
- 📈 Deciles are calculated similarly to quartiles but using K * n / 10 instead of K * n / 4.
- 🔢 Percentiles are calculated using a similar formula to quartiles but with K * n / 100 and are used to determine what percentage of data is below a certain value.
Q & A
What is the main topic of the video?
-The main topic of the video is teaching viewers how to calculate the measures of position, specifically the quartiles and percentiles, for grouped data.
What is a quartile in statistics?
-A quartile is a value that divides a data set into quarters. The first quartile (Q1) represents the 25th percentile, the second quartile (Q2, also known as the median) represents the 50th percentile, and the third quartile (Q3) represents the 75th percentile.
What is the formula for calculating the quartile position (Q_k)?
-The formula for calculating the quartile position is Q_k = (K * n) / 4, where K stands for the quartile position (1 for first quartile, 2 for second, 3 for third) and n is the total number of data points.
How do you find the lower class boundary for a grouped data set?
-To find the lower class boundary, you subtract 0.5 from the lower limit of each class interval. For example, if a class interval starts at 10, the lower class boundary would be 9.5.
What is the purpose of calculating the 'less than cumulative frequency'?
-The 'less than cumulative frequency' is used to determine the number of data points that fall below a certain value in the data set, which is essential for calculating quartiles and percentiles.
How is the class width used in the calculation of quartiles and percentiles?
-The class width is used to determine the 'part' of the class interval that corresponds to the position of the quartile or percentile within the data set. It is typically multiplied by the number of data points per class interval.
What does the first quartile (Q1) represent in terms of data distribution?
-The first quartile (Q1) represents the value below which 25% of the data points fall, indicating the lower quarter of the data set.
What is the difference between a quartile and a percentile?
-A quartile divides the data into four equal parts, representing the 25th, 50th, and 75th percentiles. A percentile, on the other hand, divides the data into 100 equal parts, each representing a specific percentage of the data set.
How do you calculate the 96th percentile of a data set?
-To calculate the 96th percentile, you use the formula P_k = lower class boundary + ((K * n) / 100) - (lower less than cumulative frequency / frequency of the percentile class) * class width, where K is 96, n is the total number of data points, and you find the value corresponding to the 96th percentile in the 'less than cumulative frequency'.
Can you provide an example of how to interpret the result of the 96th percentile calculation?
-If the calculation of the 96th percentile results in a value of 22.7, it means that 96% of the data points in the set are less than or equal to 22.7, indicating that 22.7 is the value below which 96% of the data falls.
Outlines
📊 Introduction to Grouped Data Analysis
This paragraph introduces the concept of grouped data analysis, specifically focusing on how to calculate the quartiles and percentiles of a dataset. The video script explains the process of finding the first quartile (Q1) using a formula that involves the lower class boundary, the cumulative frequency, and the class interval. It demonstrates the calculation using an example dataset grouped by age ranges and provides a step-by-step guide on how to determine the lower class boundary, the cumulative frequency, and the quartile class.
📈 Calculating the First and Third Quartiles
The second paragraph delves deeper into the calculation of the first and third quartiles (Q1 and Q3) for the given grouped data. It explains the formula for quartiles and demonstrates the process using the dataset. The script shows how to find the lower class boundary, calculate the quartile class, and determine the appropriate row in the dataset for the calculation. It also provides the formula for the third quartile and walks through the calculation, highlighting the importance of choosing the larger number when the quartile class falls between two data points.
🔢 Decile Calculation and Interpretation
In the third paragraph, the script shifts focus to the calculation of deciles. It outlines the formula for deciles and applies it to the dataset to find the fourth and sixth deciles. The process involves identifying the lower class boundary, calculating the decile class, and using the less than cumulative frequency to find the correct row in the dataset. The script emphasizes the importance of rounding and choosing the larger number when the decile class falls between two data points, and it concludes with the interpretation of what the calculated deciles represent in terms of the dataset.
📊 Percentile Calculation and Application
The fourth paragraph introduces the concept of percentiles and demonstrates how to calculate the 19th and 96th percentiles using the same dataset. The script explains the formula for percentiles and shows the process of finding the appropriate row in the dataset based on the percentile class. It discusses the importance of choosing the larger number when the percentile class falls between two data points and provides the final calculations for both the 19th and 96th percentiles, explaining what these values indicate about the dataset.
👍 Conclusion and Call to Action
The final paragraph wraps up the video script by summarizing the key points covered in the video and encouraging viewers to support the channel. It emphasizes the importance of understanding grouped data analysis and the calculations of quartiles, deciles, and percentiles. The script invites viewers to subscribe to the channel and leave comments with math topics they wish to learn, fostering engagement and further learning.
Mindmap
Keywords
💡Grouped Data
💡Quartile
💡Percentile
💡Decile
💡Lower Class Boundary
💡Cumulative Frequency
💡Class Interval
💡Less Than Cumulative Frequency
💡Quartile Formula
💡Percentile Formula
Highlights
Introduction to solving measures of position, including quartiles and percentiles for grouped data.
Explanation of the general formula for quartiles, using Q sub K and the position among quartiles.
Method to find the lower class boundary by subtracting 0.5 from the lower limits of grouped data.
Technique for calculating the less than cumulative frequency by copying and adding frequencies of consecutive groups.
Formula for quartile calculation using the lower class boundary, part of the class, and the class interval.
Determination of the first quartile (Q1) using the formula and data from the grouped table.
Interpretation of the first quartile result, indicating that 25% of the data is less than a certain value.
Process for finding the third quartile (Q3) using the same formula with adjustments for the quartile position.
Explanation of the third quartile result, which signifies that 75% of the data falls below a specific value.
Introduction to calculating deciles using a similar approach to quartiles but with a divisor of 10.
Method for determining the fourth decile (D4) and its interpretation for the data set.
Calculation of the sixth decile (D6) and its meaning in terms of the data distribution.
Explanation of the formula for percentiles, which is similar to quartiles but uses a divisor of 100.
Process for finding the 19th percentile and its implication for the data set.
Calculation of the 96th percentile to understand the upper tail of the data distribution.
Final summary of the video content, emphasizing the importance of understanding quartiles, deciles, and percentiles for data analysis.
Call to action for viewers to subscribe to the channel and suggest math topics for future videos.
Transcripts
Browse More Related Video
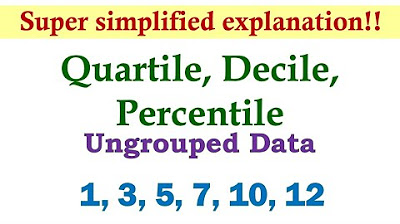
Measures of Position (Ungrouped Data) | Basic Statistics
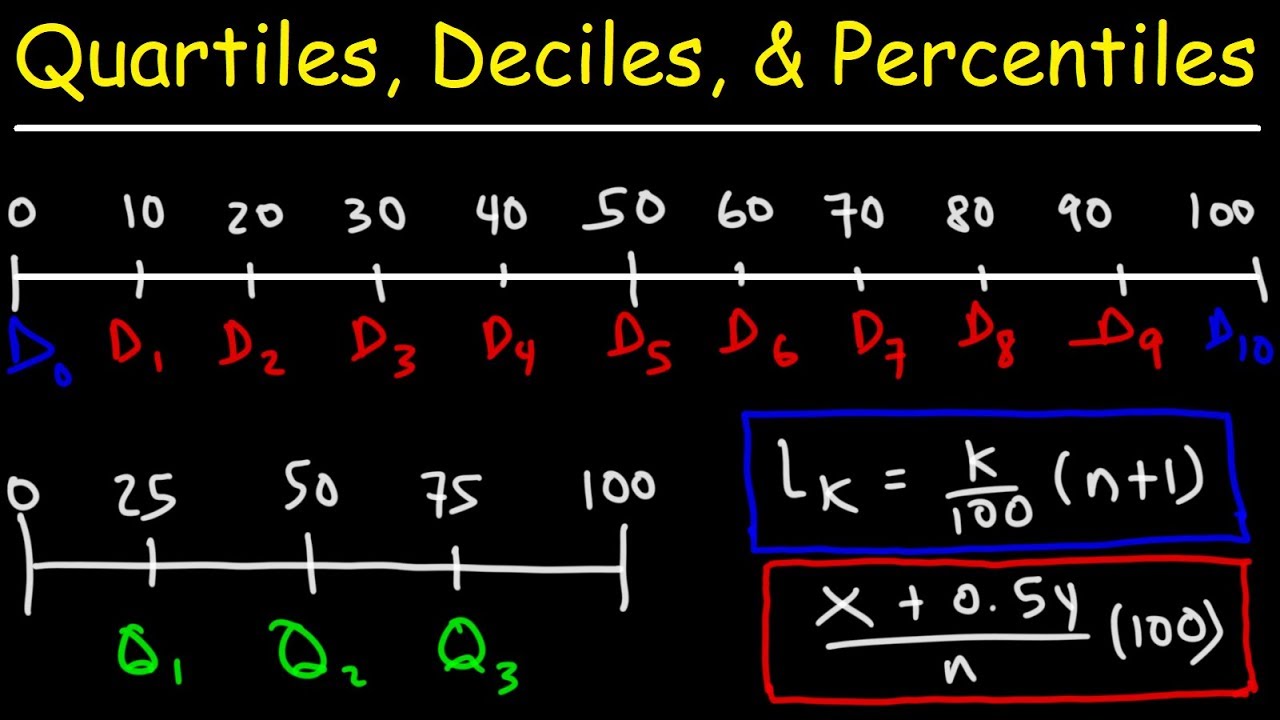
Quartiles, Deciles, & Percentiles With Cumulative Relative Frequency - Data & Statistics

Statistics: Quartiles of Grouped Data
Measures of Central Tendency (Grouped Data) | Basic Statistics
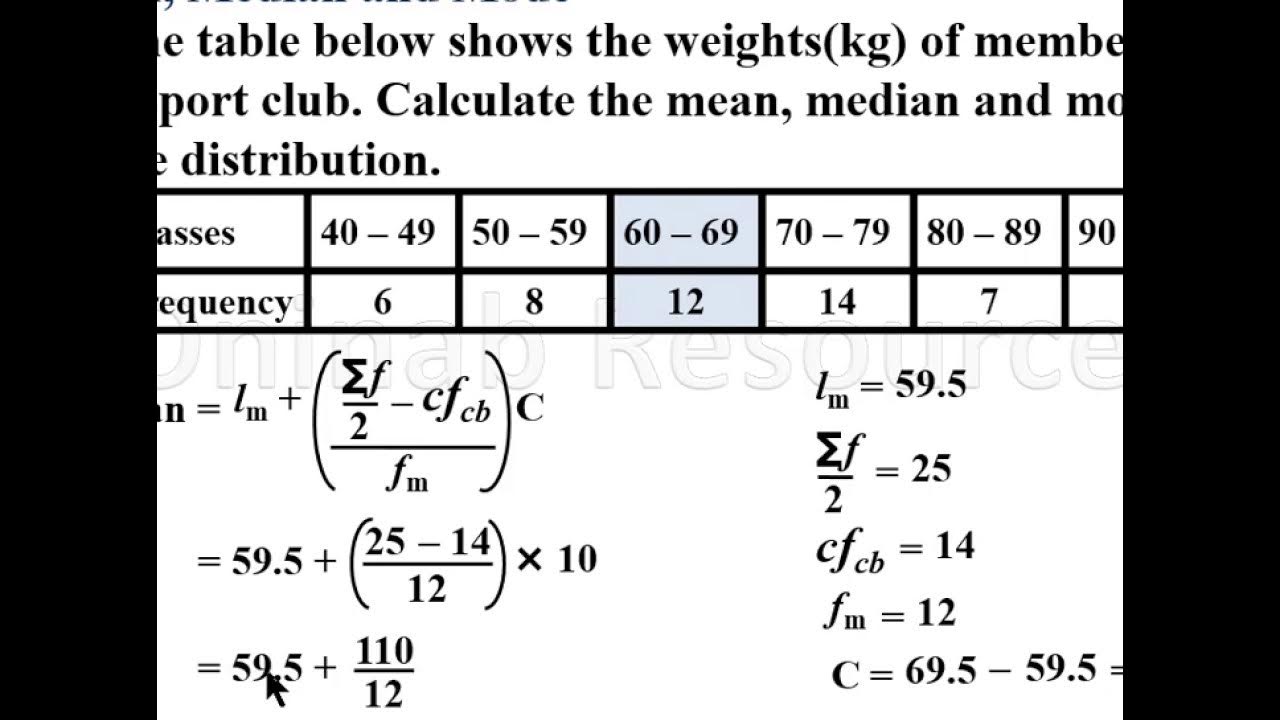
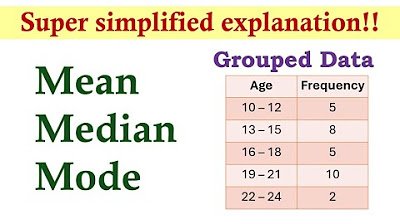
Mean, median and mode of grouped Data(Lesson 1)
Percentiles and Quartiles
5.0 / 5 (0 votes)
Thanks for rating: