Calculus 1 Lecture 0.2: Introduction to Functions.
TLDRThe video script delves into the concept of functions, explaining their dependency on variables and the necessity of each input having a unique output. It introduces various representations of functions, such as tables, graphs, and formulas, using relatable examples like fishing and weighing fish. The script also discusses piecewise functions, domain and range, and the importance of understanding whether a given equation defines a function. It touches on the natural domain of functions, emphasizing the need to consider restrictions in real-life applications. The video concludes with an exploration of even and odd functions, highlighting their symmetry properties and how to identify them algebraically.
Takeaways
- 📌 Functions are mathematical relationships where each input (X) has exactly one unique output (Y).
- 📊 The vertical line test is a method to check if a graph represents a function; every vertical line should touch the graph at most at one point.
- 🔢 The domain of a function refers to all the possible input values (X's) that can be used in the function, while the range is the set of all possible output values (Y's).
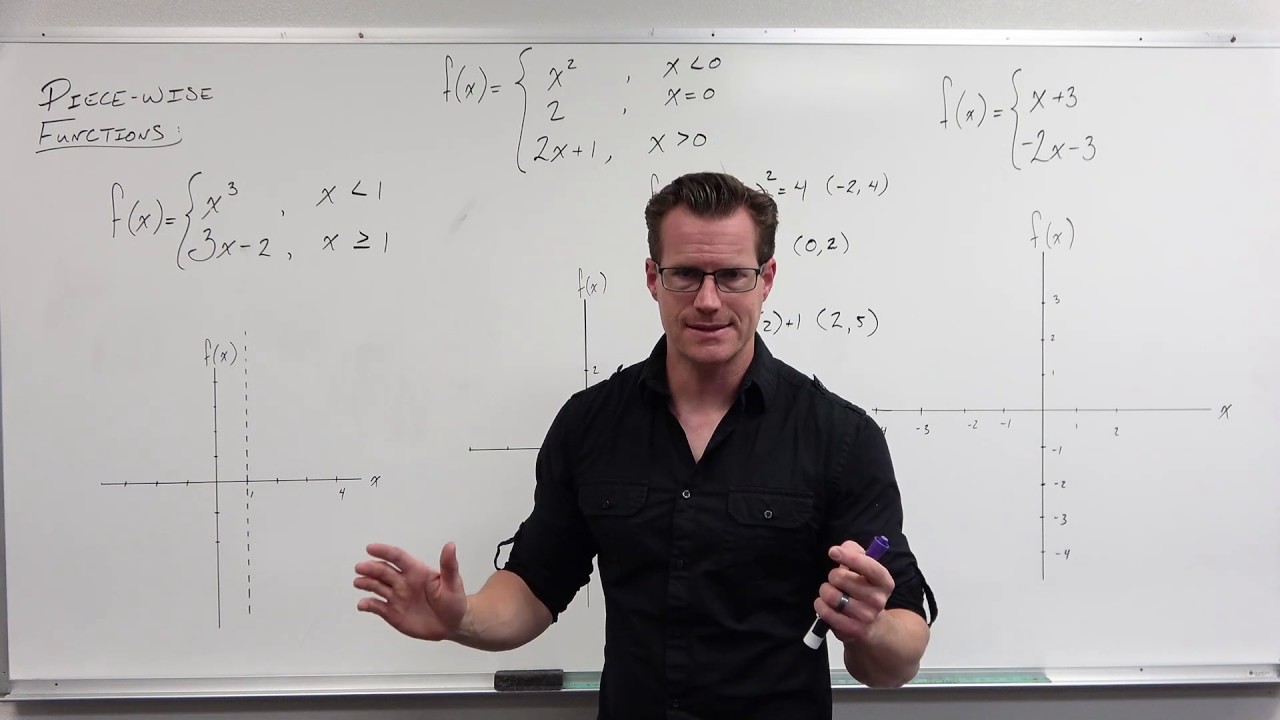
- 🦈 Piecewise functions are functions that have different expressions or rules for different parts of their domain.
- 📐 The absolute value function is an example of a piecewise function, defined differently for positive and negative inputs.
- 🤔 To determine the domain of a function, look for restrictions such as denominators equaling zero or square roots of negative numbers.
- 📶 The natural domain of a function includes all values that work within the formula, including any natural restrictions from the problem context.
- 🚫 Holes and vertical asymptotes are concepts related to domain and range; holes are removable discontinuities, while vertical asymptotes represent values that cannot be inputted or outputted.
- 📈 To find the range of a function, input values from the domain and observe the resulting outputs; the range extends from the smallest to the largest output value.
- 📝 When dealing with word problems, it's crucial to consider realistic constraints in addition to mathematical ones to determine the domain and range.
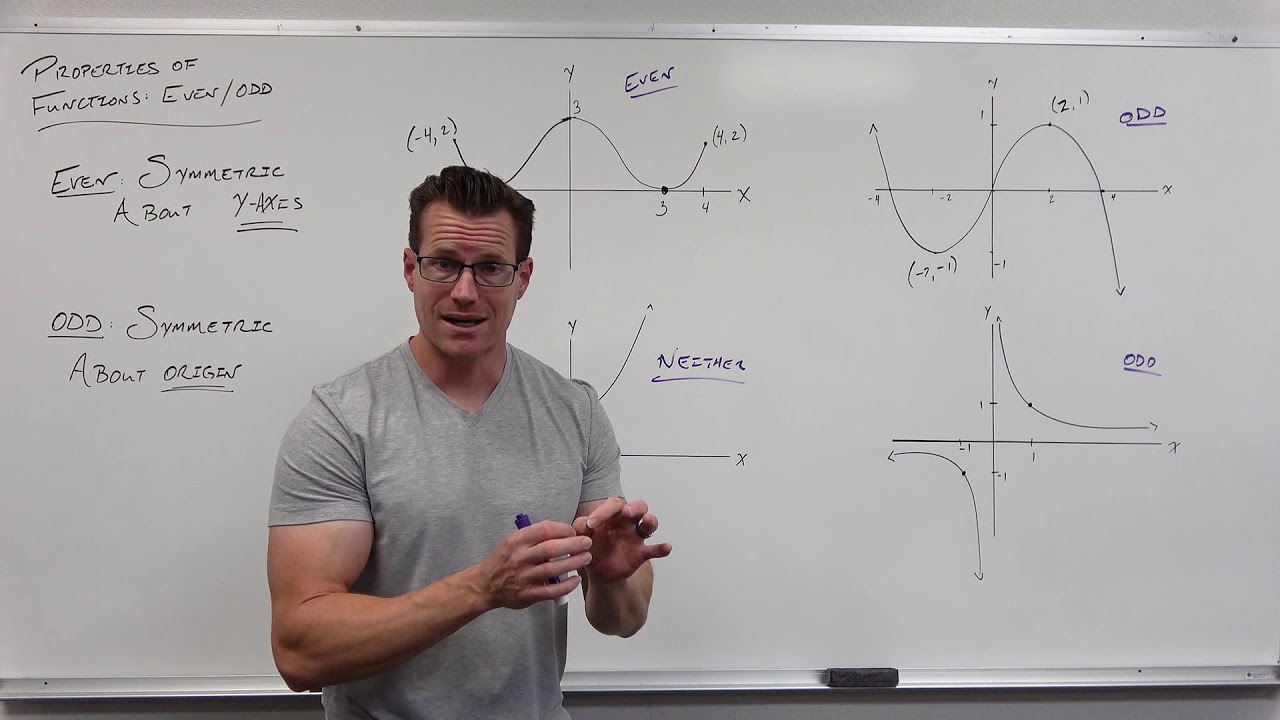
- 🔄 Even functions are symmetric across the y-axis, while odd functions are symmetric about the origin, and this can be tested by inputting negative values for x.
Q & A
What is the main concept discussed in the script?
-The main concept discussed in the script is the definition and properties of functions, including the requirement that every input must have a unique output and the various ways functions can be represented, such as through tables, graphs, and formulas.
What is the vertical line test, and how does it relate to functions?
-The vertical line test is a method to determine if a given graph represents a function. It states that for any vertical line, if it touches the graph at any point, it should touch the graph at most at one point. If a vertical line touches the graph at more than one point, the graph does not represent a function.
What is the difference between a function and a non-function graph?
-A function graph has the property that each input value (x-coordinate) corresponds to exactly one output value (y-coordinate). In contrast, a non-function graph may have input values that correspond to more than one output value, which violates the definition of a function.
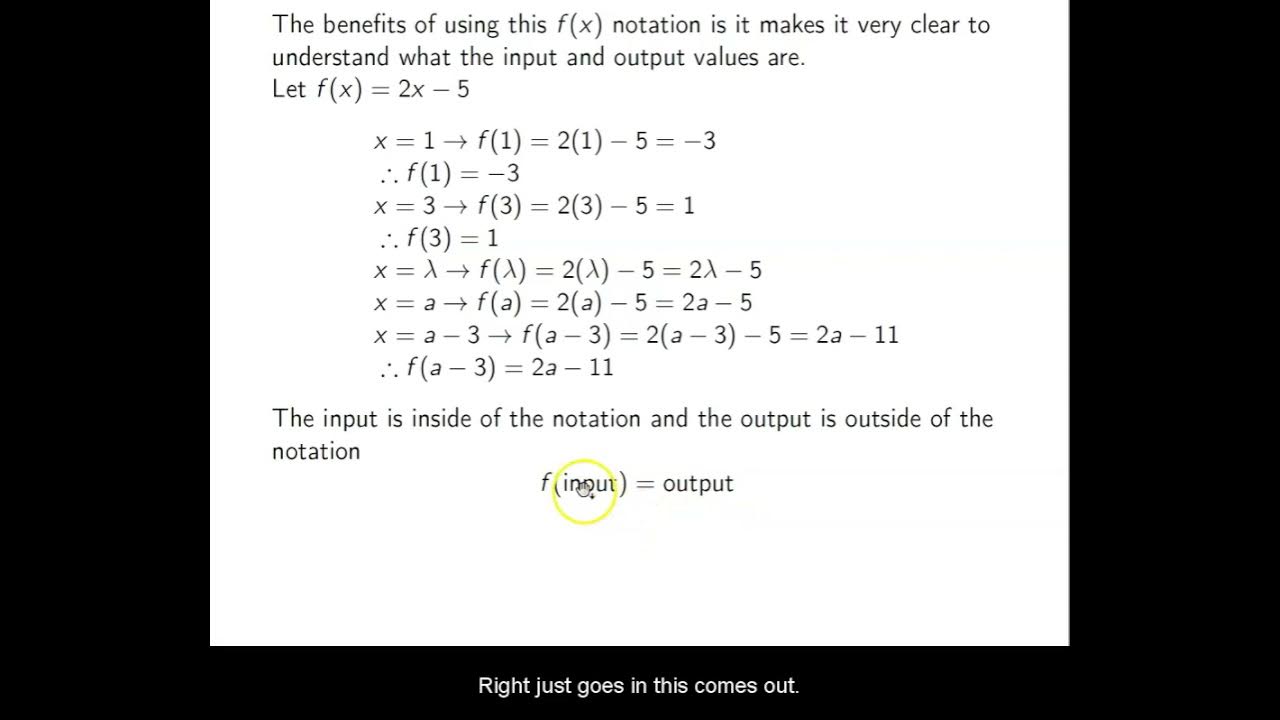
How can you represent a function using different notations?
-A function can be represented using various notations such as f(x), g(x), or h(x), where 'x' is the input and 'f', 'g', or 'h' denotes the function. This allows for distinguishing between different functions, especially when dealing with multiple functions at once.
What is a piecewise function, and how is it defined?
-A piecewise function is a function that is defined by different formulas for different parts or intervals of its domain. It is defined by specifying the formula to use for each interval, ensuring that each input value falls within the correct interval according to the function's domain.
What is the significance of the domain and range of a function?
-The domain of a function is the set of all possible input values that can be used in the function, while the range is the set of all possible output values that result from using those inputs. Understanding the domain and range is crucial for determining the behavior of a function and the type of problems it can be used to model.
How does the script illustrate the concept of functions using the example of fishing?
-The script uses the example of catching fish and recording their weights to illustrate the concept of functions. Each fish caught (input) has a unique weight (output), and this relationship between the inputs and outputs represents a function, where each input has a specific, unique output.
What is the relationship between the inputs and outputs in a function, and why is it important?
-In a function, each input must correspond to exactly one output. This one-to-one relationship is essential because it ensures that for every input value, there is a unique output value. This is important for the function to be well-defined and predictable, which is crucial in mathematical modeling and various applications.
How does the script explain the concept of one-to-one functions?
-The script explains that a one-to-one function is a function where each input value maps to a unique output value, and each output value corresponds to a unique input value. This means that there is no repetition of outputs for different inputs, ensuring a clear and unique relationship between inputs and outputs.
What is the significance of the example of the circle in the script?
-The example of the circle in the script is used to illustrate that not all mathematical relationships are functions. While a circle can be represented by a formula, it does not pass the vertical line test because a single value of 'x' can correspond to two values of 'y' (the top and bottom halves of the circle), violating the definition of a function.
How does the script demonstrate the concept of even and odd functions?
-The script demonstrates the concept of even and odd functions by showing how the function changes when a negative value is inputted. For even functions, the output remains the same whether the input is positive or negative, while for odd functions, the output is the opposite of the input's sign.
Outlines
📚 Introduction to Functions
The paragraph introduces the concept of functions, emphasizing the need for each input to have a unique output. It explains that functions can be represented in various ways, such as tables, graphs, and formulas. The speaker uses a fishing anecdote to illustrate the definition of a function, where each fish caught corresponds to a unique weight. The importance of a function's ability to map each input to a single output is highlighted, and the concept of dependent and independent variables is briefly touched upon.
📈 Graphing Functions and the Vertical Line Test
This paragraph delves into the graphical representation of functions and the vertical line test. It explains that every vertical line should touch the graph of a function at most at one point, indicating a function. The speaker clarifies that even if a graph does not pass the vertical line test, it can still represent a function if each input corresponds to a single output. The concept of one-to-one functions and the notation used to distinguish between different functions are also discussed.
🔢 Understanding Piecewise Functions and the Absolute Value Function
The paragraph introduces piecewise functions, where the formula for a function changes based on the input value. The absolute value function is used as an example to demonstrate how a function can behave differently for positive and negative inputs. The speaker explains how to define the absolute value function piecewise and how to graph it. The concept of domain and the importance of considering the appropriate range when graphing piecewise functions are also highlighted.
📊 Graphing Piecewise Functions and Domain Restrictions
This paragraph continues the discussion on graphing piecewise functions, emphasizing the need to delineate the x-axis by appropriate intervals and graph each piece individually. The speaker provides an example of a piecewise function that includes a horizontal line, a semi-circle, and a diagonal line, and explains how to graph each part while considering the domain restrictions. The concept of domain is further explored, discussing how it represents all possible inputs for a function and how real-life constraints can limit the domain.
🌐 Finding the Natural Domain and Range of Functions
The paragraph discusses the process of finding the natural domain of a function, which includes all values that work within the formula, as well as the range, which represents the possible outputs. The speaker explains how to identify problem areas in a function, such as denominators and roots, and how these can restrict the domain. The concept of the natural domain is introduced, which considers both the formulaic restrictions and any natural constraints of the problem.
📈 Determining Domain and Range Through Sign Analysis
This paragraph focuses on the method of determining the domain and range of functions through sign analysis. The speaker explains how to identify intervals that yield positive or negative results when tested with a function, particularly those involving square roots. The process of using a number line and testing points within the function to ascertain which intervals are valid for the domain is detailed. The concept of a quadratic inequality and its role in determining the domain is also discussed.
📊 Understanding Discontinuities and Their Types
The paragraph discusses the concept of discontinuities in functions, differentiating between removable discontinuities (holes) and vertical asymptotes. The speaker clarifies that while removable discontinuities can be fixed by plugging in a single point, vertical asymptotes cannot be canceled out and represent a more significant issue in the function's domain. The importance of maintaining the original domain even when a function is simplified is emphasized to avoid losing critical information about the function's behavior.
📈 Finding Domain and Range for Piecewise Functions
This paragraph explains the process of finding the domain and range for piecewise functions. The speaker provides an example where the domain is restricted by certain values of x, leading to a vertical asymptote. The range is determined by considering the output of the function for various inputs within the domain. The speaker also discusses the difference between holes and vertical asymptotes in the context of piecewise functions and how they affect the domain and range.
📈 Applying Domain and Range Concepts to Word Problems
The paragraph demonstrates how to apply the concepts of domain and range to real-world problems, specifically in the context of manufacturing cardboard boxes. The speaker outlines the need to consider practical constraints, such as the size of the cardboard and the dimensions of the cuts made for folding the box. The process of determining the domain based on these constraints and calculating the volume (range) of the box as a function of the cut size is detailed.
📊 Exploring Even and Odd Functions
This paragraph explores the properties of even and odd functions. The speaker explains that even functions are symmetric across the y-axis, producing the same output for both positive and negative inputs, while odd functions are symmetric about the origin, inverting the output for negative inputs. The process of testing a function for evenness or oddness by substituting negative values for the input variable is described, and examples are provided to illustrate the concepts.
Mindmap
Keywords
💡Function
💡Input and Output
💡Graphs and Tables
💡Vertical Line Test
💡Piecewise Functions
💡Domain and Range
💡Even and Odd Functions
💡Absolute Value
💡Square Roots
💡Polynomials
💡Trigonometric Functions
Highlights
The fundamental concept of a function is introduced, where every input has a unique corresponding output.
The importance of vertical line test in determining whether a given graph represents a function is explained.
The mathematical concept of piecewise functions is introduced, with an example of absolute value function.
The method of graphing piecewise functions by plotting each piece for the appropriate domain range is discussed.
The concept of domain and range in the context of functions is explained, with emphasis on their practical constraints.
The natural domain of a function is defined, including all values that work within the formula and respect the problem's inherent restrictions.
A method for finding the domain of a function by setting the denominator equal to zero and solving is presented.
The process of finding the domain and range of functions involving square roots, emphasizing the need for non-negative radicands.
The difference between vertical asymptotes (holes) and horizontal asymptotes in the context of function domains and ranges is clarified.
A real-world application of finding the domain and range of a function is provided, using the example of making cardboard boxes.
The concept of even and odd functions is introduced, with a method to determine whether a function is even, odd, or neither.
A detailed explanation of how to determine if a function is even by substituting negative x and comparing the output to the original function.
An example is given to demonstrate the process of determining if a function is odd by substituting negative x and analyzing the resulting expression.
The importance of considering realistic constraints, such as the inability to have negative measurements, when determining the domain of a function is emphasized.
The concept of removable discontinuities is introduced, explaining how certain domain issues can be resolved by adding a single point.
The method for finding the domain of a function with square roots by setting the radicand greater than or equal to zero is discussed.
The process of finding the range of a function by plugging in values from the domain and observing the output is explained.
The difference between horizontal and vertical asymptotes in the context of function graphs is clarified, with examples provided.
An example of a piecewise function is given, and the method for graphing each piece individually is demonstrated.
The concept of simplifying a function while retaining the original domain constraints is discussed, emphasizing that simplification cannot eliminate domain problems.
Transcripts
Browse More Related Video
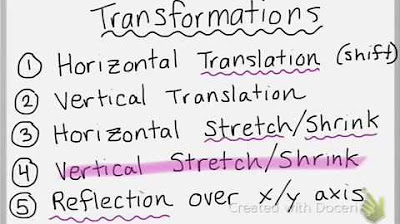
Introduction to Transformations of Functions
Business Calculus - Math 1329 - Section 1.1 - Functions
Ch. 2.1 Functions
Properties of Functions - Even vs Odd (Precalculus - College Algebra 8)
How to Graph Piecewise Functions (Precalculus - College Algebra 12)
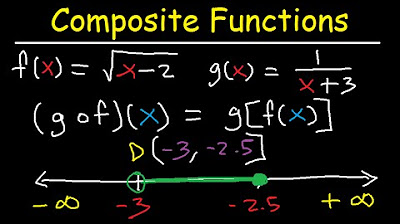
Composite Functions Domain Fractions & Square Roots / Radicals - Inverse Functions & Graphs
5.0 / 5 (0 votes)
Thanks for rating: