Measures of Position (Ungrouped Data) | Basic Statistics
TLDRThis educational video script teaches viewers how to calculate quartiles, deciles, and percentiles for ungrouped data, using the example dataset 1, 3, 5, 7, 10, 12. It explains the formulas for determining positions in the data set and illustrates how to find the first, second, and third quartiles, as well as the interquartile range. The script also covers how to calculate deciles and percentiles, which are essential for understanding data distribution and identifying outliers. The clear step-by-step process makes it accessible for those looking to enhance their statistical skills.
Takeaways
- 📊 The video teaches how to solve for quartiles, deciles, and percentiles of ungrouped data.
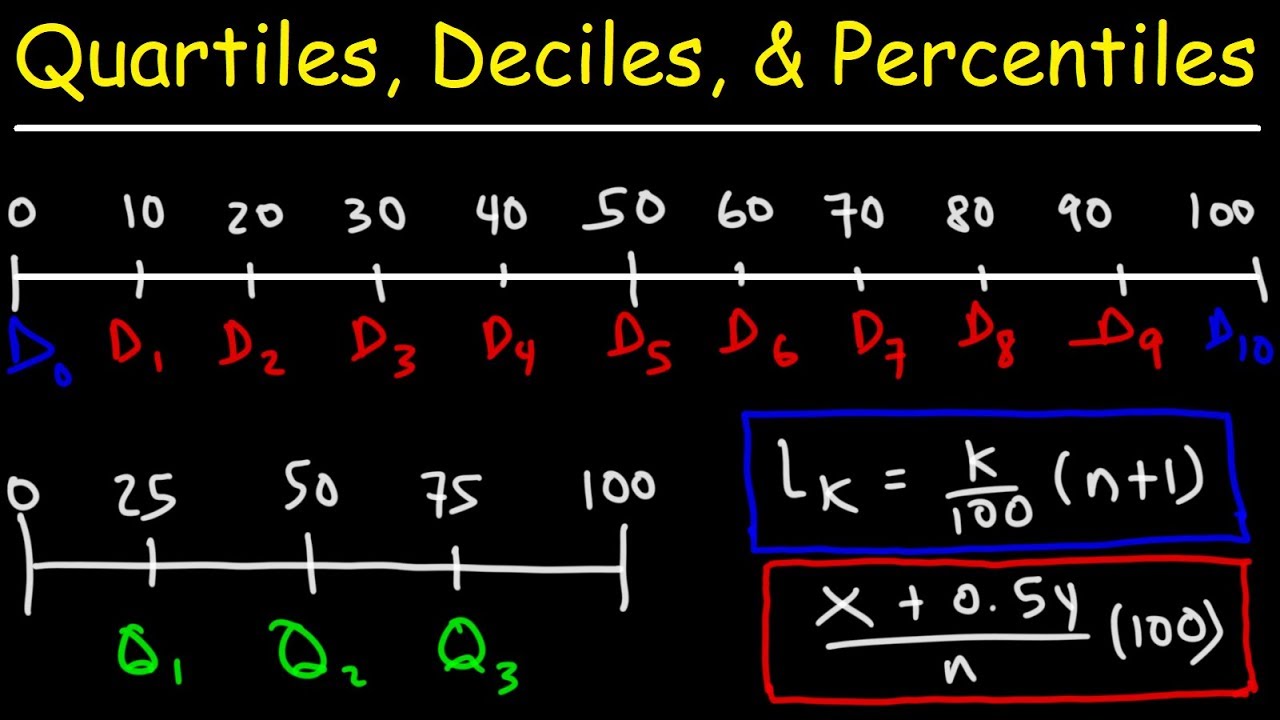
- 🔢 Quartiles divide the data into four parts using the formula K * (n + 1) / 4, where K represents the quartile position.
- 1️⃣ The first quartile (Q1) calculation example: For data [1, 3, 5, 7, 10, 12], Q1 is 2.5.
- 2️⃣ The second quartile (Q2), or the median, is calculated similarly, and for the given data, Q2 is 6.
- 3️⃣ The third quartile (Q3) example: For the same data set, Q3 is 10.5.
- 📈 The interquartile range (IQR) is the difference between Q3 and Q1, indicating data spread and potential outliers.
- 🔟 Deciles divide the data into ten parts using the formula K * (n + 1) / 10. For example, the third decile (D3) is 3.2 for the given data.
- 8️⃣ The eighth decile (D8) example: For the data set, D8 is 11.2.
- 💯 Percentiles divide the data into 100 parts with the formula K * (n + 1) / 100. For example, the 45th percentile (P45) is 5.3.
- 6️⃣ Another percentile example: The 68th percentile (P68) for the data is 9.28.
- 📚 The video emphasizes understanding these measures of position to determine the value or position of a number in a data set.
Q & A
What are quartiles and why are they important in data analysis?
-Quartiles divide data into four equal parts and are important as they provide a measure of position that can determine the value given a specific position or vice versa. They help in understanding the distribution of data and identifying outliers.
What is the formula used to calculate the quartile position?
-The formula to calculate the quartile position is \( K \times (n + 1) / 4 \), where \( K \) stands for the quartile position (1 for first, 2 for second, 3 for third) and \( n \) is the number of data points.
How do you find the first quartile (Q1) for a given dataset?
-To find the first quartile (Q1), use the formula with \( K = 1 \), calculate the position, and then interpolate between the first and second data points if necessary to get the exact Q1 value.
What is the median and how does it relate to the second quartile (Q2)?
-The median is the middle value of a dataset when arranged in ascending order. It is equivalent to the second quartile (Q2), which is calculated using the formula with \( K = 2 \).
How do you calculate the third quartile (Q3) of a dataset?
-The third quartile (Q3) is calculated using the formula with \( K = 3 \). Similar to Q1, you determine the position and then interpolate between the fifth and sixth data points to find the exact Q3 value.
What is the Interquartile Range (IQR) and why is it significant?
-The Interquartile Range (IQR) is the difference between the third quartile (Q3) and the first quartile (Q1). It is significant because it measures the spread of the middle 50% of the data and helps in identifying outliers.
How do deciles differ from quartiles in terms of data division?
-Deciles divide data into ten equal parts, as opposed to quartiles which divide data into four parts. The formula for calculating deciles is similar to quartiles but uses 10 as the divisor.
What is the formula for calculating the position of a decile?
-The formula for calculating the position of a decile is \( K \times (n + 1) / 10 \), where \( K \) is the decile position from 1 to 10.
How do you find the 8th decile of a dataset?
-To find the 8th decile, use the formula with \( K = 8 \), determine the position, and then interpolate between the appropriate data points to get the exact value.
What are percentiles and how do they relate to deciles?
-Percentiles divide data into 100 equal parts, providing a more granular measure of position than deciles. The formula for calculating percentiles is similar to deciles but uses 100 as the divisor.
How do you calculate the 45th percentile of a dataset?
-To calculate the 45th percentile, use the formula with \( K = 45 \), find the position, and then interpolate between the appropriate data points to determine the exact value.
What does the 68th percentile represent in terms of data distribution?
-The 68th percentile represents a value below which 68% of the data falls. It is an example of a percentile that can be used to understand the spread of data points around the median.
Outlines
📊 Introduction to Quartiles and Deciles
This paragraph introduces the concept of quartiles and deciles as measures of position within a dataset. The speaker explains how to calculate these using a formula that involves the position (K), the number of data points (n), and the desired quartile or decile. The example data set 1, 3, 5, 7, 10, 12 is used to illustrate the calculation of the first quartile (Q1), which involves arranging the data and using the formula to find the position of the value that separates the lower 25% of the data. The calculation leads to the first quartile being 2.5, indicating that 25% of the data is less than this value.
📈 Calculating the Second and Third Quartiles
The speaker continues by explaining the process of calculating the second (Q2) and third quartiles (Q3). Q2 is equated to the median, which is found using the formula with K set to 2. The calculation results in Q2 being 6, reflecting the value below which 50% of the data falls. For Q3, with K set to 3, the formula is applied to find a position that leads to the third quartile being 10.5, meaning 75% of the data is below this value. The importance of the interquartile range (IQR) is also highlighted as a measure to detect outliers, which is the difference between Q3 and Q1, calculated to be 3 in this example.
🔢 Understanding Deciles and Their Calculation
Deciles are discussed as a way to divide data into ten parts, with the formula for calculating them being similar to that of quartiles but divided by 10. The speaker demonstrates how to find the third decile using the formula, which results in a value of 3.2, indicating that 30% of the data is below this point. An additional example of finding the eighth decile is given, resulting in a value of 11.2, which means 80% of the data is less than this value.
📊 Determining Percentiles for Data Analysis
The final paragraph focuses on percentiles, which are used to divide data into 100 parts. The formula for percentiles is similar to deciles but divided by 100. Two examples are given: calculating the 45th percentile, which is found to be 5.3, and the 68th percentile, which is approximately 9.28. These values show that 45% and 68% of the data, respectively, are below these points. The speaker concludes by encouraging viewers to subscribe and suggest math topics for future videos.
Mindmap
Keywords
💡Quartile
💡Decile
💡Percentile
💡Interquartile Range (IQR)
💡Outliers
💡Median
💡Position
💡Measures of Position
💡Data Arrangement
💡Substitution
💡Order of Operations
Highlights
The video teaches how to calculate quartiles, deciles, and percentiles for ungrouped data.
Quartiles divide data into four parts and are calculated using a specific formula involving the position and number of data points.
The formula for quartiles is K * (n + 1) / 4, where K represents the quartile position.
Quartiles are measures of position that determine the value given a position or vice versa.
Interquartile range (IQR) is the difference between the third and first quartiles and helps identify outliers.
Deciles divide data into ten parts and are calculated similarly to quartiles but with a divisor of 10.
Percentiles divide data into 100 parts and are calculated using the formula K * (n + 1) / 100.
The video provides a step-by-step guide to finding the first quartile of a given dataset.
The second quartile is equivalent to the median and is calculated as the middle value of the dataset.
The third quartile is calculated using the formula with K set to 3, indicating the 75th percentile.
A detailed example is given to calculate the first quartile, resulting in a value of 2.5.
The second quartile or median is found to be 6, indicating that 50% of the data is less than this value.
The third quartile calculation results in a value of 10.5, with 75% of the data being less than this value.
The interquartile range is calculated to be 3, providing insight into data spread and potential outliers.
The video demonstrates how to calculate the third decile with an example, resulting in a value of 3.2.
An example calculation for the 8th decile is provided, yielding a value of 11.2.
The 45th percentile is calculated, showing that 45% of the data is less than 5.3.
The 68th percentile is calculated, indicating that 68% of the data is less than 9.28.
The video concludes with an invitation to subscribe and suggest math topics for future content.
Transcripts

5.0 / 5 (0 votes)
Thanks for rating: