3.3.2 Measures of Relative Standing and Boxplots - Percentiles
TLDRThis video script delves into the concept of computing and interpreting percentiles, offering a method to measure a value's relative standing within a data set. It explains the definition of percentiles, the common formula used for their calculation, and the potential discrepancies between different software. The script provides a step-by-step guide on finding the percentile for a given value, using an example of cell phone data speeds, and clarifies how to interpret the results. It also introduces the notation for variables used in percentile calculations and presents a flowchart for converting a percentile to a data value, concluding with an example to illustrate the process.
Takeaways
- 📊 The video discusses learning outcome number two, which focuses on computing and interpreting percentiles and finding the percentile of a given value.
- 📈 Z-scores measure the relative standing of a value in terms of standard deviations from the mean, whereas percentiles provide a different measure of relative standing.
- 🔢 Percentiles divide a dataset into 100 equal groups, with each group representing approximately 1% of the data values.
- 🤔 There is no universal agreement on how to compute percentiles, and different software may yield slightly different results.
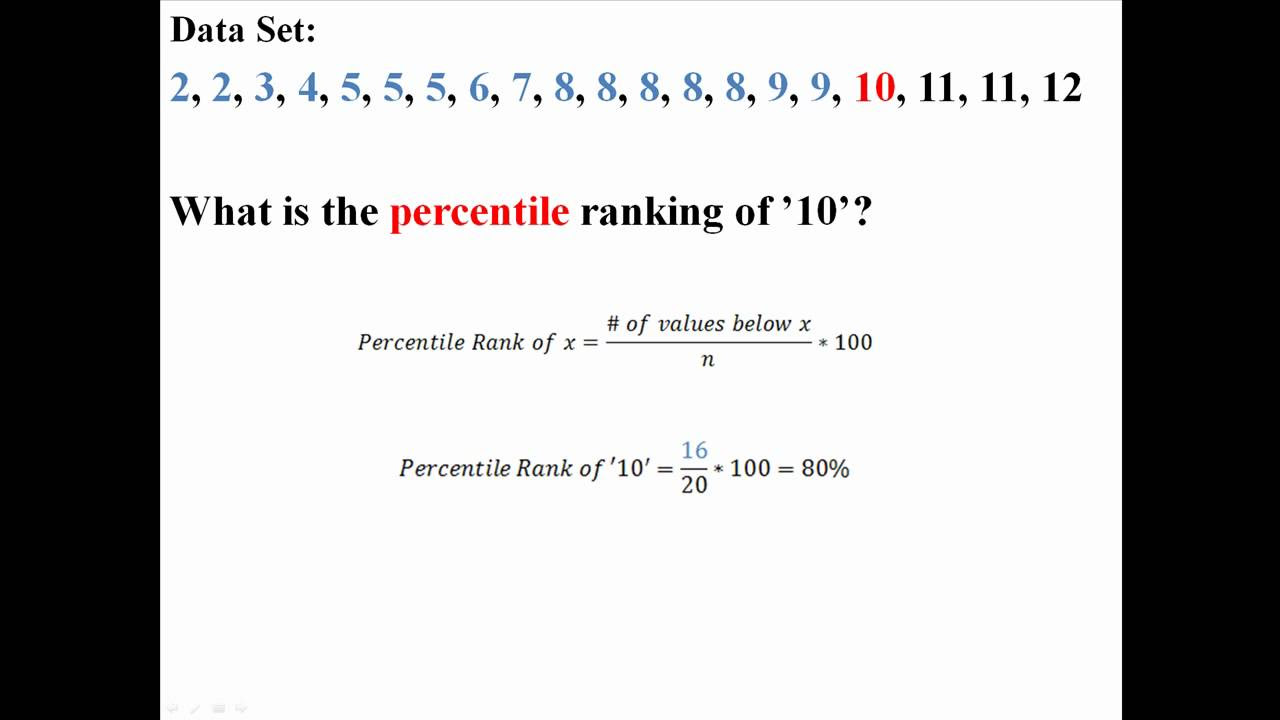
- 📝 The class uses a specific formula for computing percentiles, which is the number of values less than x divided by the total number of values, then multiplied by 100.
- 📋 To find a percentile, the data must be sorted, and the total number of values (n) and the number of values less than the target value (x) must be known.
- 📉 The example in the script involves airport Verizon cell phone data speeds, and the process of finding the percentile for a data speed of 15.1 megabits per second is demonstrated.
- 👉 The 15.1 megabit per second speed is found to be at the 58th percentile, meaning approximately 58% of the data values are less than this speed.
- 🔑 Key variables in the script include n (total number of values), k (the percentile of interest), l (locator for the position of a data value), and p_sub_k (the kth percentile).
- 🔄 The script includes a flowchart for converting from a percent to a data value, which involves sorting the data, computing the locator, and finding the value at the specified percentile.
- 📚 The video concludes with an example of converting from a percentile to a data value, illustrating the process of finding the 30th percentile in a dataset.
Q & A
What is the main topic discussed in the video?
-The main topic discussed in the video is learning outcome number two, which focuses on computing and interpreting percentiles and finding the percentile of a given value.
What is a z-score and how does it relate to relative standing in a data set?
-A z-score is a measure of relative standing that indicates how many standard deviations an element is from the mean. A positive z-score means the value is above the mean, while a negative z-score indicates it is below the mean.
What are percentiles and how do they measure relative standing?
-Percentiles are measures of location that divide a data set into 100 equal groups, each representing approximately 1% of the data values. They provide a measure of relative standing by indicating the percentage of data values that are below a particular value.
Why might different software or calculators give slightly different percentile values?
-Different software or calculators might use slightly different formulas to compute percentiles, which can result in minor variations in the values obtained.
What is the formula used in the video to calculate the percentile of a value?
-The formula used in the video to calculate the percentile of a value is the number of values less than x divided by the total number of values, multiplied by 100.
How do you interpret the percentile of 15.1 megabits per second being at the 58th percentile?
-The interpretation is that approximately 58% of the data values are less than 15.1 megabits per second, and about 42% of the data values are greater than 15.1 megabits per second.
What is the significance of the locator (l) in calculating percentiles?
-The locator (l) gives the position of a data value relative to all other values in the data set. It helps to identify the value at a specific percentile when the data is sorted.
How is the 30th percentile calculated if the data set has 50 values?
-To calculate the 30th percentile for a data set with 50 values, you would find the value halfway between the 15th and 16th values in the sorted data set.
What does the flowchart on page 116 of the text represent?
-The flowchart on page 116 represents an algorithm to convert from a percent to a data value, helping to find a percentile in a data set.
Why is it necessary to sort the data before finding a percentile?
-Sorting the data is necessary to arrange the values in ascending order, which allows for the accurate identification of the value(s) that correspond to a specific percentile.
How is the mean of two values calculated in the context of finding a percentile?
-The mean of two values is calculated by adding the two values together and dividing by two. This is used when determining the value that lies halfway between two data points for a specific percentile.
Outlines
📊 Understanding Percentiles and Z-Scores
The first paragraph introduces the concept of computing and interpreting percentiles, which are measures of relative standing within a dataset. It explains that percentiles divide data into 100 equal groups and each percentile (p1 to p99) represents approximately 1% of the data values. The paragraph clarifies that there is no universal agreement on how to compute percentiles, and different software may yield slightly different results. The provided formula for calculating the percentile of a value x is the number of values less than x divided by the total number of values, multiplied by 100. An example using airport Verizon cell phone data speeds is given to demonstrate how to find the percentile rank of a specific data value, in this case, 15.1 megabits per second, which is found to be at the 58th percentile.
🔢 Interpreting Percentiles and Their Calculation
The second paragraph delves deeper into the interpretation of percentiles, noting that while they provide a rough estimate, they are not perfect due to potential data value repetitions and varying calculation methods. It introduces the notation used for different variables in percentile calculations, such as n for the total number of values, k for the specific percentile of interest, and l as the locator for the position of a data value within the dataset. The paragraph also explains the concept of the kth percentile, which is the value below which k percent of the data fall. Additionally, a flowchart from the textbook is mentioned, which outlines the steps to convert a percentile into a data value, emphasizing the process of sorting data, computing the locator, and determining the kth percentile based on whether the locator is a whole number or not.
📈 Calculating the 30th Percentile with an Example
The third paragraph focuses on the practical application of calculating a specific percentile, using the 30th percentile as an example. It explains the process of computing the locator l and identifying k and n, which are the percentile of interest and the total number of data values, respectively. The example demonstrates that if l is a whole number, the kth percentile is not the data value at that position but halfway between that value and the next one in the sorted list. The calculation for the 30th percentile of the data speeds is shown, where the value halfway between the 15th and 16th values (10.2 and 10.3) is determined to be 10.25 megabits per second, indicating that approximately 30% of the values are less than this speed, and 70% are greater.
Mindmap
Keywords
💡Percentiles
💡Z-scores
💡Relative Standing
💡Data Values
💡Excel
💡Formula
💡Sample Size
💡Locator
💡Data Speeds
💡Interpretation
Highlights
The video discusses learning outcome number two, which focuses on computing and interpreting percentiles and finding the percentile of a given value.
Z-scores are explained as a measure of relative standing, indicating how many standard deviations a value is from the mean.
Percentiles are introduced as measures of location that divide a data set into 100 groups, each representing approximately 1% of the data values.
Different software and methods may yield slightly different percentile values due to the lack of universal agreement on computation methods.
The textbook's specific formula for computing percentiles is presented, which divides the number of values less than x by the total number of values and multiplies by 100.
An example using airport Verizon cell phone data speeds is given to demonstrate the calculation of the percentile for a data speed of 15.1 megabits per second.
The process of finding the total number of values in a data set and the number of values less than a specific value is explained for percentile calculation.
The interpretation of the 58th percentile for the data speed of 15.1 megabits per second is provided, indicating that about 58% of data values are less than this speed.
The notation used for different variables in percentile calculations is explained, including n for total values, k for the percentile of interest, and l as the locator for a data value's position.
A flowchart from the textbook is introduced to convert from a percent to a data value, providing an algorithm for finding a percentile in a data set.
The method for computing the locator l is detailed, which involves taking the desired percentile k and dividing it by 100, then multiplying by the total number of values n.
The distinction between handling whole number and non-whole number locators is discussed, with examples of how to find the kth percentile in each case.
An example is provided to find the 30th percentile, illustrating the process of locating the value halfway between the 15th and 16th values in a sorted data set.
The final calculation for the 30th percentile is shown, resulting in a value of 10.25 megabits per second, which separates the bottom 30% from the top 70% of data values.
The video concludes with a summary of the learning outcome, explaining the importance of understanding percentiles for statistical analysis and interpretation.
Transcripts
Browse More Related Video
Percentiles and Quartiles
Percentiles, Quantiles and Quartiles in Statistics | Statistics Tutorial | MarinStatsLectures

Percentiles and Percentile Ranks
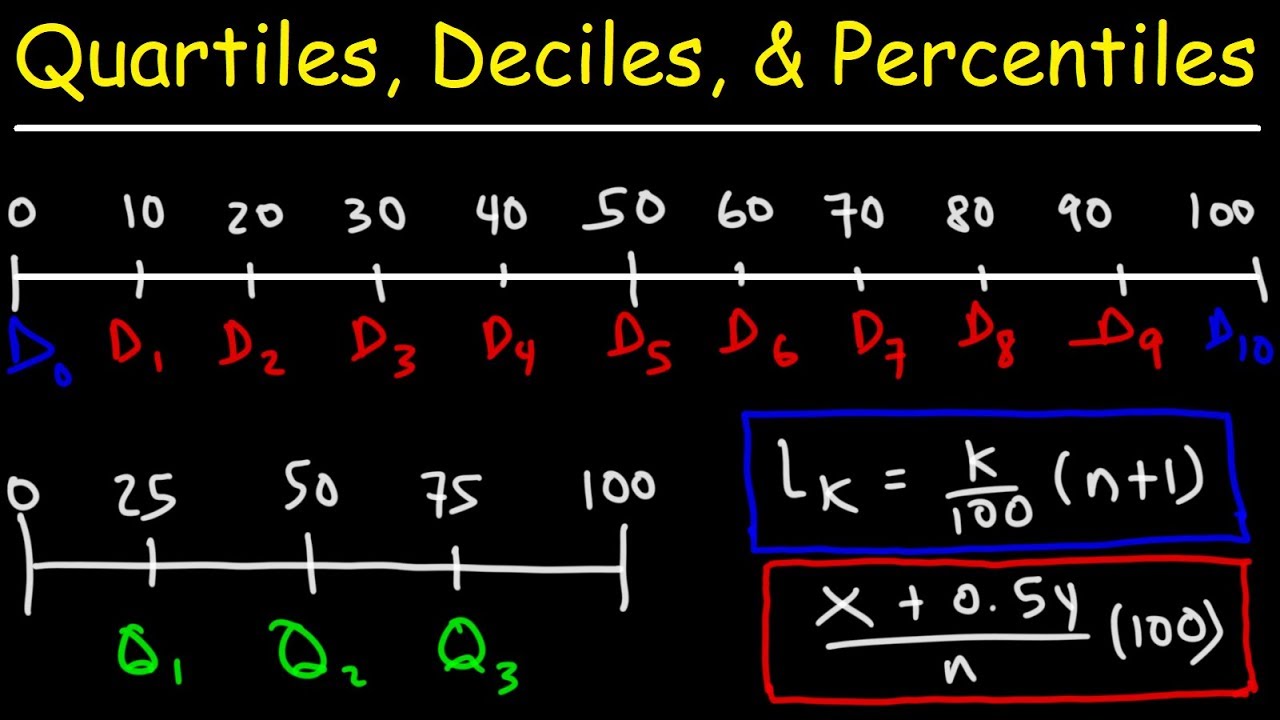
Quartiles, Deciles, & Percentiles With Cumulative Relative Frequency - Data & Statistics

Percentiles - How to calculate Percentiles, Quartiles, ...

Median, Mean, Mode, Percentile | Math, Statistics for data science, machine learning
5.0 / 5 (0 votes)
Thanks for rating: