Percentiles, Quantiles and Quartiles in Statistics | Statistics Tutorial | MarinStatsLectures
TLDRThe video script introduces the concepts of percentiles, quantiles, and quartiles, emphasizing their importance in understanding data distribution. It explains that while there are subtle differences between percentiles and quantiles, they are often used interchangeably. The script highlights the median (50th percentile), first quartile (25th percentile), and third quartile (75th percentile) as key points in data analysis. It also touches on how these statistical measures can be visualized using box plots and how they can be calculated using statistical software like R. The video aims to help viewers grasp the usefulness of these concepts in interpreting data, rather than focusing on the calculation methods.
Takeaways
- 📊 Percentiles and quantiles are often used interchangeably, despite a slight difference between them.
- 🔢 The 50th percentile or median is the value that divides a dataset into two equal halves, with 50% of observations below and 50% above it.
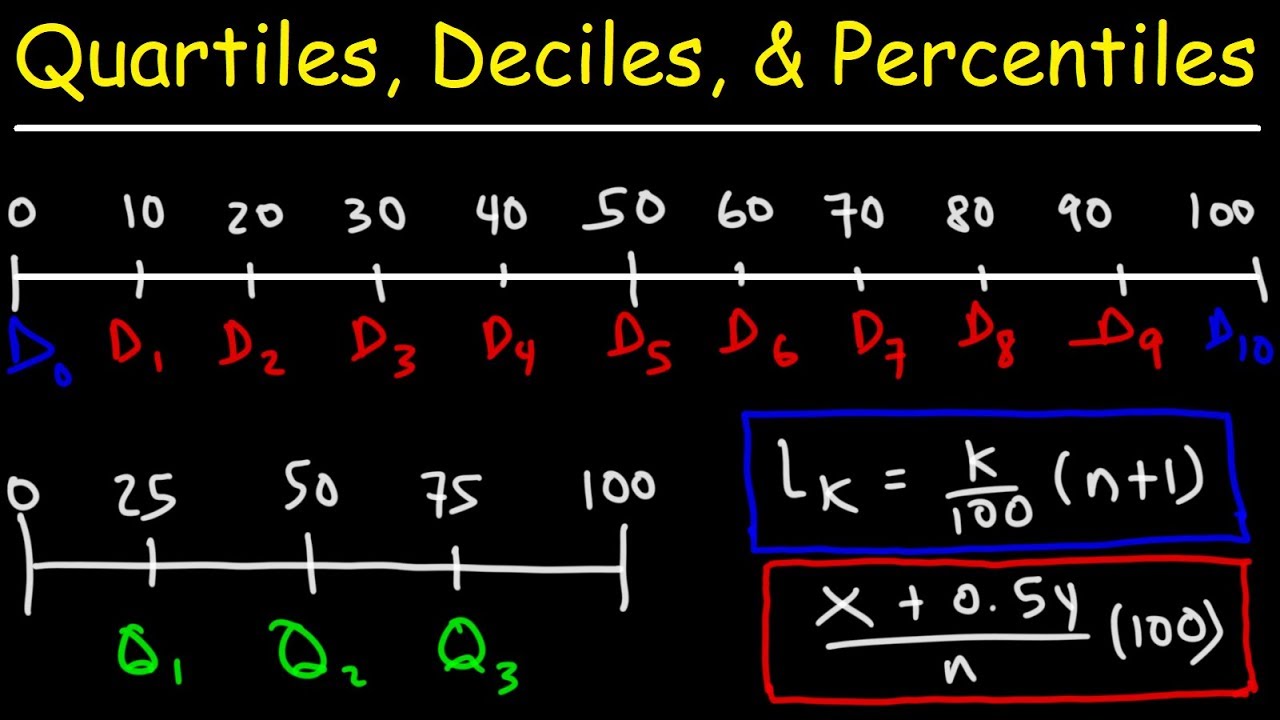
- 📈 Quartiles are specific values of a percentile or quantile; the first quartile (Q1) is the 25th percentile, and the third quartile (Q3) is the 75th percentile.
- 📊 Q1 (first quartile) divides the data into 1/4 below and 3/4 above, representing the 25th percentile.
- 📊 Q3 (third quartile) divides the data into 3/4 below and 1/4 above, representing the 75th percentile.
- 🚀 Software like R is typically used for calculating percentiles and quantiles due to the complexity and variety of methods available for such calculations.
- 📊 The box plot is a graphical representation of the median, Q1, Q3, minimum, and maximum values in a dataset.
- 📈 Percentiles and quantiles are useful for understanding the distribution of data and the relative standing of an observed value within that distribution.
- 🔄 You can determine the percentile of an observed value by comparing it to the distribution of other values in the dataset.
- 📊 Other divisions of data include tertiles (dividing data into three equal parts), quintiles (five groups), and deciles (ten equally sized groups).
Q & A
What is the main topic of the video?
-The main topic of the video is the explanation of percentiles, quantiles, and quartiles, including their definitions and applications.
Is there a difference between percentiles and quantiles?
-There is a slight subtle difference between the two, but they can be used interchangeably for most purposes.
What is the median and why is it significant?
-The median is the 50th percentile or quantile, which has 50% of the ordered observations below it and 50% above. It is significant because it represents the value that cuts the dataset in half.
What are the first and third quartiles, and what do they represent?
-The first quartile (Q1) is the 25th percentile, representing a point where 25% of observations are below it. The third quartile (Q3) is the 75th percentile, representing a point where 75% of observations are below it. Together, they divide the data into four quarters.
How is a box plot related to quartiles?
-A box plot is a graphical visualization that represents the median, first quartile (Q1), third quartile (Q3), minimum, and maximum values of a dataset.
What is the purpose of calculating percentiles and quantiles?
-Percentiles and quantiles are useful for understanding the distribution of data, where observations fall within the dataset, and for comparing values within that distribution.
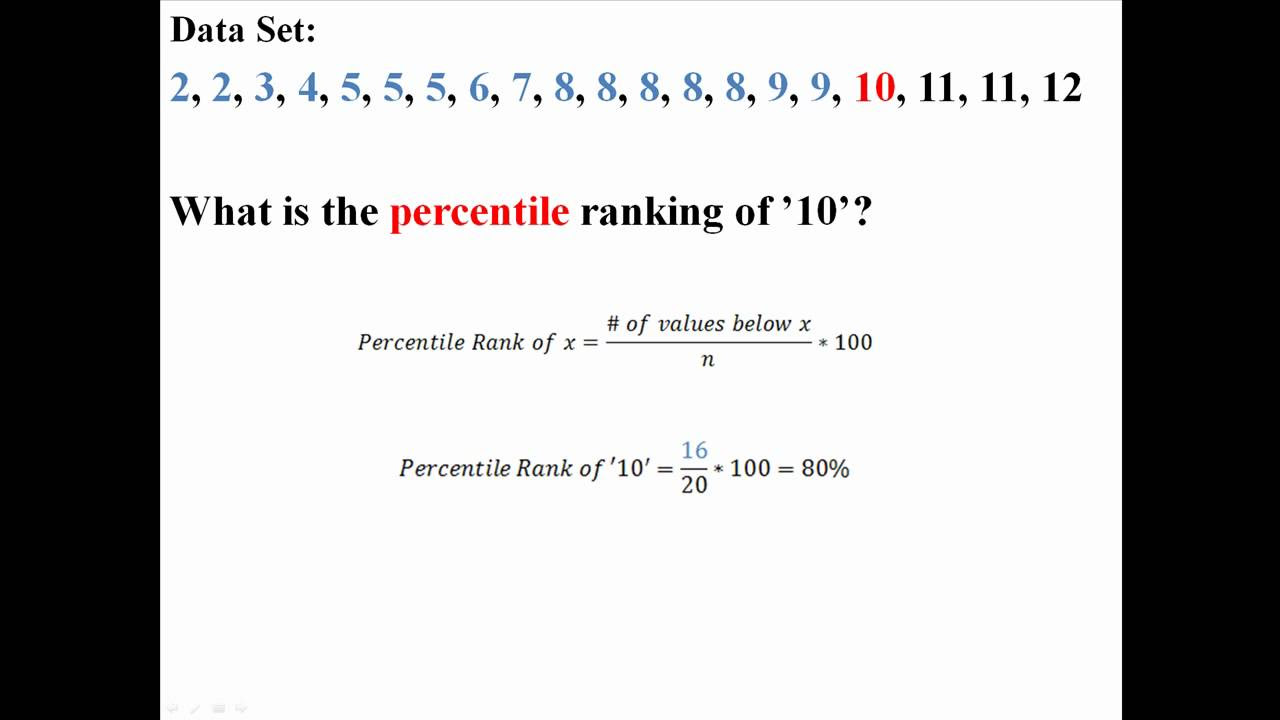
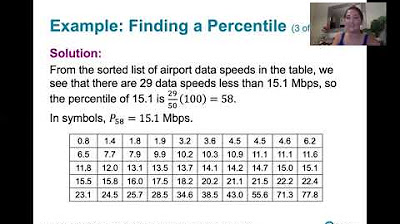
How can you determine the percentile of a specific observed value?
-You can determine the percentile of a specific observed value by finding the proportion of observations that are below that value within the dataset.
What are some other ways data can be divided using percentiles?
-Data can be divided into terciles (lowest third, middle third, upper third), quintiles (five groups), or deciles (ten equally sized groups), depending on the analysis needs.
Why is it important to understand the concept of percentiles and quantiles?
-Understanding the concept of percentiles and quantiles is important for data analysis as it helps in interpreting the relative standing of values within a dataset and in comparing different datasets.
In the context of the video, how can the grade of 82 be interpreted in terms of percentile?
-If a grade of 82 falls in the 80th percentile, it means that the grade is higher than 80 percent of the class scores.
What is the role of statistical software like R in calculating percentiles and quantiles?
-Statistical software like R is used to calculate percentiles and quantiles because it can handle complex calculations and provide accurate results, which would be difficult to do manually.
Outlines
📊 Introduction to Percentiles, Quantiles, and Quartiles
This paragraph introduces the concepts of percentiles, quantiles, and quartiles, highlighting their interchangeability in most contexts. It emphasizes the focus on understanding the concepts rather than calculations, which are typically performed using statistical software like R. The video aims to clarify the use of these statistical measures through a simple example of student grades, visualizing data on a number line and explaining the special terms for the 50th percentile (median), 25th percentile (first quartile or Q1), and 75th percentile (third quartile or Q3). The paragraph also mentions that while the exact calculation methods may vary, the main goal is to grasp the underlying concepts and their applications.
📈 Interpreting Percentiles and Their Practical Applications
The second paragraph delves into the practical applications of percentiles, discussing how they can be used to interpret data and provide insights into the distribution of values within a dataset. It explains how the first and third quartiles divide the data into quarters and how they can be reported alongside other percentiles. The paragraph also touches on the reverse application of percentiles, where an observed value can be assessed to determine its position within the dataset. It concludes by mentioning other statistical divisions such as terciles, quintiles, and deciles, and encourages viewers to subscribe for more informative content on similar topics.
Mindmap
Keywords
💡Percentiles
💡Quantiles
💡Quartiles
💡Median
💡First Quartile (Q1)
💡Third Quartile (Q3)
💡Box Plot
💡Data Distribution
💡Statistical Software
💡R Software
💡Conceptual Understanding
Highlights
Percentiles and quantiles are discussed, with a subtle difference between the two but often used interchangeably.
Quartiles are specific values of a percentile or quantile, and the video will focus on their concepts rather than calculations.
The video uses statistical software R for calculations, which has nine different ways of calculating percentiles or quantiles.
The 50th percentile is also known as the median, which divides the data into half, with 50% of observations below and above it.
The 25th percentile is called the first quartile (Q1), having 25% of observations below it.
The 75th percentile is known as the third quartile (Q3), with 75% of observations below it.
Box plots are a graphical visualization of the median, first quartile, third quartile, minimum, and maximum values.
Percentiles and quartiles help in understanding the distribution of data and the relative standing of a value within that distribution.
The video emphasizes the importance of understanding percentiles and quantiles rather than getting stuck on the technicalities of their calculation.
Other reported divisions of data include terciles, quintiles, and deciles, breaking data into thirds, fifths, or tenths respectively.
Knowing the percentile of a score provides context on how well it performs relative to the entire set of data.
The example of student grades is used to illustrate the concepts of percentiles and quartiles, keeping the dataset small and simple for clarity.
The minimum and maximum values represent the 0th and 100th percentiles respectively.
Understanding the spread and average of a dataset helps in interpreting individual scores within the context of the entire class or group.
In practice, calculating percentiles and quantiles is usually done with software, not by hand, due to the complexity and efficiency.
The video encourages viewers to subscribe for more content on similar educational topics.
Transcripts
Browse More Related Video
Quantiles and Percentiles, Clearly Explained!!!
Percentiles and Quartiles
Quartiles, Deciles, & Percentiles With Cumulative Relative Frequency - Data & Statistics

What are Quartiles? Percentiles? Deciles?

Median, Mean, Mode, Percentile | Math, Statistics for data science, machine learning
3.3.2 Measures of Relative Standing and Boxplots - Percentiles
5.0 / 5 (0 votes)
Thanks for rating: