Statistics - Excel
TLDRThe video provides an overview of key Excel functions used in statistics, demonstrating how to efficiently calculate sums, averages, standard deviation, variance, quartiles, percentiles, and deciles. It explains the usefulness of these functions for data analysis rather than manual computation, walking through examples of finding measures of central tendency like mean and median as well as spreads like range and interquartile range. The instructor shows how to leverage built-in Excel formulas for faster insights from data.
Takeaways
- 😃 How to calculate SUM, COUNT, AVERAGE, MEDIAN, MODE, MIN, MAX, RANGE, STDEV, VAR using Excel functions
- 📈 Use SUM() to total a column; COUNT() to count data points; AVERAGE() & taking SUM/COUNT to calculate mean
- 📊 MEDIAN is the middle number; MODE appears most frequently; MIN & MAX find range extrema
- 📉 STDEV and VAR calculate standard deviation and variance; VAR = STDEV^2
- 🎯 QUARTILES divide data into 4 equal parts; specify quartile number (0-4) to return
- 🔢 PERCENTILES divide data into 100 equal parts; specify percentile (0-1 decimal) to return
- 🎲 DECILES use PERCENTILE function to divide data into 10 equal parts; specify decile number * 0.1
- 😊 Useful for statistics classes and analyses requiring summary math on data sets
- 🤓 Apply to data in a single column; highlight column as array input parameter
- 📚 Functions covered: SUM, COUNT, AVERAGE, MEDIAN, MODE, MIN, MAX, RANGE, STDEV, VAR, QUARTILES, PERCENTILES
Q & A
What Excel function is used to calculate the sum of a column of values?
-The SUM function. You would type =SUM( and then highlight the column of values and close the parenthesis.
What Excel function counts the number of data points in a column?
-The COUNT function. You would type =COUNT( and then select the column of values and close the parenthesis.
How can you calculate the average or mean in Excel?
-You can take the SUM of the values and divide it by the COUNT to get the average. Or you can use the AVERAGE function and highlight the column of data to take the average of.
What does the MEDIAN function calculate in Excel?
-The MEDIAN function calculates the middle number in a range of values. It is the 50th percentile.
What does the MODE function calculate in Excel?
-The MODE function calculates the number that appears most frequently in a data set. It is the number with the highest frequency.
How can you find the minimum and maximum values in a data set using Excel?
-Use the MIN and MAX functions. Highlight the column of data after typing =MIN( or =MAX( to output the minimum or maximum values.
How is variance calculated from standard deviation?
-Variance is equal to the standard deviation squared. So once you have calculated standard deviation, you can square that value to find the variance.
What are quartiles and how are they calculated in Excel?
-Quartiles divide a data set into four equal groups. The QUARTILE function can calculate them. Quartile 1 is the 25th percentile, Quartile 2 is the 50th percentile (median), Quartile 3 is the 75th percentile.
How can you calculate percentiles in Excel?
-Use the PERCENTILE function. Highlight the data set, then after the comma enter the decimal value of the percentile you want. For example, 0.5 would give the 50th percentile.
How do you calculate deciles in Excel?
-Deciles divide data into tenths. Use the PERCENTILE function as Excel does not have a decile function. For example, to find the 3rd decile, calculate the 30th percentile by entering 0.3 after highlighting the data.
Outlines
📈 Excel Functions for Sum, Count, Avg, Median, Mode, Min, Max, Range, Stdev, Variance
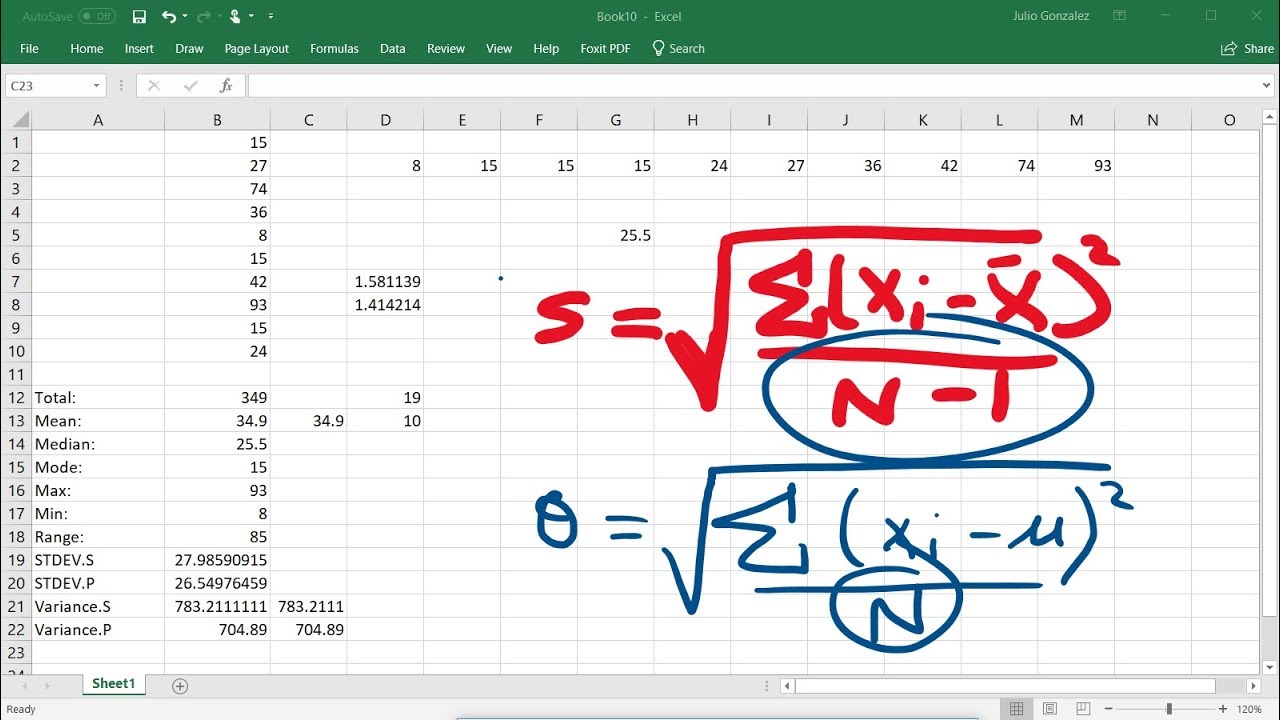
This paragraph describes how to calculate various statistics in Excel, including the sum, count, average/mean, median, mode, minimum, maximum, range, standard deviation, and variance of data in a column. It shows the Excel functions and formula syntax for each of these.
📊 Quartiles & Percentiles in Excel
This paragraph discusses how to calculate quartiles and percentiles for a data set in Excel. It shows how to use the quartile and percentile functions, specifying the quartile or percentile decimal value. It calculates several examples including 25th percentile, median, and 75th percentile.
⚖️ Excel Functions for Deciles
This paragraph explains that deciles divide data into tenths, similar to how quartiles use fourths. It shows how to calculate deciles in Excel using the percentile function, giving examples of different deciles corresponding to various percentiles.
Mindmap
Keywords
💡Sum
💡Count
💡Average
💡Median
💡Mode
💡Standard deviation
💡Variance
💡Quartiles
💡Percentiles
💡Deciles
Highlights
Learn how to calculate sum, count, average, mean in Excel using built-in functions
Median is the middle number in a dataset
Mode is the number with the highest frequency in a dataset
Use MIN and MAX functions to find minimum and maximum values
Range is the difference between maximum and minimum values
Use STDEV and VAR functions to calculate standard deviation and variance
Variance is the square of standard deviation
Quartiles divide data into four parts, percentiles divide into 100 parts
Use QUARTILE and PERCENTILE functions to calculate quartiles and percentiles
Deciles divide data into 10 parts, calculate using PERCENTILE function
0 decile is minimum, 10th decile is maximum value
1st decile equals 10th percentile, 2nd decile is 20th percentile, etc.
5th decile equals 50th percentile, which is the median
Know how to calculate statistical measures for data analysis
Excel has built-in functions to easily calculate statistics
Transcripts
Browse More Related Video
Calculating The Standard Deviation, Mean, Median, Mode, Range, & Variance Using Excel

Live Day 2- Basic To Intermediate Statistics
Elementary Statistics - Chapter 3 Describing Exploring Comparing Data Measure of Central Tendency

What is Descriptive Statistics? A Beginner's Guide to Descriptive Statistics!

Descriptive Statistics [Simply explained]
Measures of Spread: Crash Course Statistics #4
5.0 / 5 (0 votes)
Thanks for rating: