What are Quartiles? Percentiles? Deciles?
TLDRThis video explores quartiles, percentiles, and deciles, collectively known as quantiles. It explains how these concepts split ordered datasets into equal sections: quartiles into four, deciles into ten, and percentiles into a hundred. The video demonstrates calculating these quantiles using a small dataset, emphasizing their usefulness with larger datasets. It also touches on the differences in calculating quartiles, depending on whether the median is included or excluded, and concludes with practical advice for handling quantile calculations using software.
Takeaways
- 📊 Quantiles, including quartiles, percentiles, and deciles, are measures used to divide an ordered dataset into equal parts to understand the distribution of data.
- 🔢 The median is a special case of a quantile, representing the middle value of an ordered dataset and can be thought of as the observation halfway through the data.
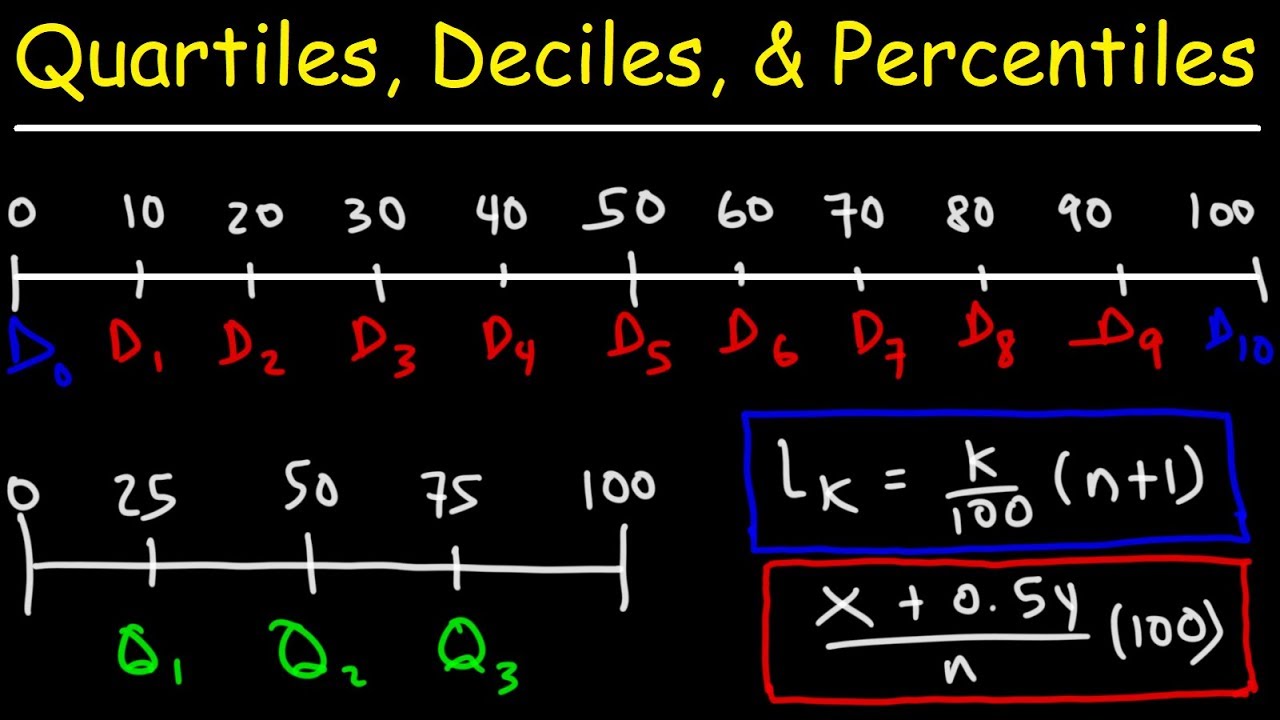
- 📈 Quartiles split the data into four equal parts, with the first quartile (Q1) being 1/4 of the way through the dataset and the third quartile (Q3) being 3/4 of the way through.
- 🔟 Deciles divide the dataset into ten equal parts, each representing 1/10th of the dataset, with the first decile at 1/10th and the tenth decile at the maximum value.
- 💯 Percentiles divide the dataset into hundred equal parts, with each percentile representing 1% of the dataset's distribution.
- 📝 The 5-number summary of a dataset includes the minimum, first quartile (Q1), median, third quartile (Q3), and the maximum, providing a quick statistical overview.
- 🤔 Calculating quartiles for small datasets can be less meaningful, as the inclusion or exclusion of the median in the calculation can lead to different results.
- 📊 When calculating quartiles, one can either include or exclude the median in the calculation of the lower and upper halves of the dataset, leading to two different methods.
- 🛠 Excel provides functions to calculate quartiles both including and excluding the median, but the choice of method may not significantly impact results in larger datasets.
- 📚 For academic purposes, it's recommended to use the formula provided by the institution, but in practice, the exact method of calculation is less critical for larger datasets.
- 👍 The video encourages viewers to use default settings in statistical software for quantiles and to focus on understanding the overall data distribution rather than the specifics of quantile calculation.
Q & A
What are quantiles and why are they important in statistics?
-Quantiles, including quartiles, percentiles, and deciles, are statistical measures that divide a dataset into equal parts. They are important because they provide insights into the distribution of data, helping to understand the central tendency and spread without being affected by outliers.
How is an ordered dataset defined in the context of quantiles?
-An ordered dataset is a set of observations arranged in ascending or descending order. This arrangement is essential for calculating quantiles, as they are determined by their position within the ordered set.
What is the median and how does it relate to the concept of quartiles?
-The median is the middle value of an ordered dataset. It is also the second quartile (Q2), which means it divides the dataset into two equal halves. The concept of quartiles extends this by dividing the dataset into four equal parts, with the median being one of these quartile points.
Can you explain the difference between quartiles, deciles, and percentiles?
-Quartiles divide a dataset into four equal parts, with the second quartile being the median. Deciles divide the dataset into ten equal parts, each representing one-tenth of the data. Percentiles divide the dataset into a hundred equal parts, each representing one percent of the data.
What is the purpose of the 5-number summary in statistics?
-The 5-number summary is a descriptive statistic that includes the minimum, first quartile (Q1), median (second quartile, Q2), third quartile (Q3), and maximum of a dataset. It provides a concise summary of the data's distribution, including its spread and skewness.
How do you calculate the first and third quartiles for a small dataset?
-For a small dataset, you can calculate the first and third quartiles by finding the median of the lower and upper halves of the dataset, respectively, excluding the median itself. Alternatively, including the median in the calculation will give you different values, which is a method that some software like Excel supports.
Why might quartiles be less useful in a small dataset?
-Quartiles are less useful in a small dataset because they may not accurately represent the distribution of the data due to the limited number of observations. The values of quartiles can change significantly with small changes in the dataset, making them less reliable indicators of the data's spread.
What does Excel's QUARTILE function do and how does it handle small datasets?
-Excel's QUARTILE function calculates the quartile value for a dataset. For small datasets, it offers two methods: one that excludes the median from the calculation (QUARTILE.EXC) and one that includes the median (QUARTILE.INC). The choice between these methods can affect the quartile values, especially in smaller datasets.
What advice does the speaker give for dealing with quartiles in university studies?
-The speaker advises students to use the formula or method they have been given for calculating quartiles, but also to remember that the exact method of calculation is less important than understanding the concept, especially when dealing with larger datasets where the differences between methods become negligible.
Why does the speaker suggest that the method of calculating quartiles is less important in practice?
-The speaker suggests that the method of calculating quartiles is less important because in practice, especially with larger datasets, the different methods of calculation converge on similar values. Therefore, the focus should be on understanding the concept and using the default settings provided by statistical software.
Outlines
📊 Introduction to Quantiles
This paragraph introduces the concept of quantiles, including quartiles, percentiles, and deciles, as a part of descriptive statistics. The speaker explains that quantiles are used to divide a dataset into equal parts to understand the distribution of data. The median is highlighted as a key quantile, being the middle value of an ordered dataset. The paragraph sets the stage for a deeper dive into the specifics of quartiles and other quantiles, emphasizing their importance in data analysis.
🔢 Calculating Quantiles in a Small Dataset
The second paragraph delves into the practical calculation of quantiles, specifically focusing on a small dataset with seven observations. The speaker discusses the five-number summary, which includes the minimum, first quartile, median, third quartile, and maximum. The process of calculating quartiles by excluding or including the median in smaller datasets is explored, with examples provided to illustrate the differences in results. The paragraph also touches on the use of Excel functions for quartile calculation and the importance of understanding the methodology behind quantile calculation, even if it's often done by computers for larger datasets.
Mindmap
Keywords
💡Quantiles
💡Dataset
💡Median
💡Quartiles
💡Deciles
💡Percentiles
💡Descriptive Statistics
💡Five-Number Summary
💡Central Tendency
💡Spread
💡Excel
Highlights
The video discusses quartiles, percentiles, and deciles, collectively known as quantiles, which are measures used to describe the location of a dataset.
Quantiles are straightforward in concept and are part of a series on descriptive statistics.
An ordered dataset is considered for understanding quantiles, emphasizing the importance of the dataset's arrangement from smallest to largest.
The median is highlighted as the middle number of a dataset and also as the observation halfway through the ordered dataset.
Quartiles are introduced as points that split the dataset into four equal parts, with the first quartile being 1/4 of the way through the dataset.
The video explains that the second quartile is the median, and the third quartile is another point that divides the dataset.
Deciles are described as splitting the dataset into tenths, with each decile representing a 1/10 portion of the dataset.
Percentiles are introduced, dividing the dataset into hundredths, with the first percentile being 1% of the way through the dataset.
The concept of the 5-number summary is presented, including the minimum, quartile 1, median (quartile 2), quartile 3, and maximum.
A method for calculating quartiles in a small dataset is demonstrated, using the median of subsets excluding the overall median.
An alternative method for calculating quartiles is mentioned, which includes the median in the calculation of quartiles for subsets.
Excel's functionality for calculating quartiles, including different methods (excluding or including the median), is briefly discussed.
The video advises that for larger datasets, the method of calculating quartiles becomes less critical as values converge.
The importance of using default settings in software for calculating quantiles is emphasized for practical purposes.
The video concludes by suggesting that the exact method of calculating quantiles is less important than understanding their conceptual use in descriptive statistics.
A call to action for viewers to subscribe or explore more videos on the topic is made at the end of the video.
Transcripts
Browse More Related Video
Quartiles, Deciles, & Percentiles With Cumulative Relative Frequency - Data & Statistics
Percentiles, Quantiles and Quartiles in Statistics | Statistics Tutorial | MarinStatsLectures
Quantiles and Percentiles, Clearly Explained!!!
Measures of Position (Ungrouped Data) | Basic Statistics
Quantile-Quantile Plots (QQ plots), Clearly Explained!!!
Statistics - Excel
5.0 / 5 (0 votes)
Thanks for rating: