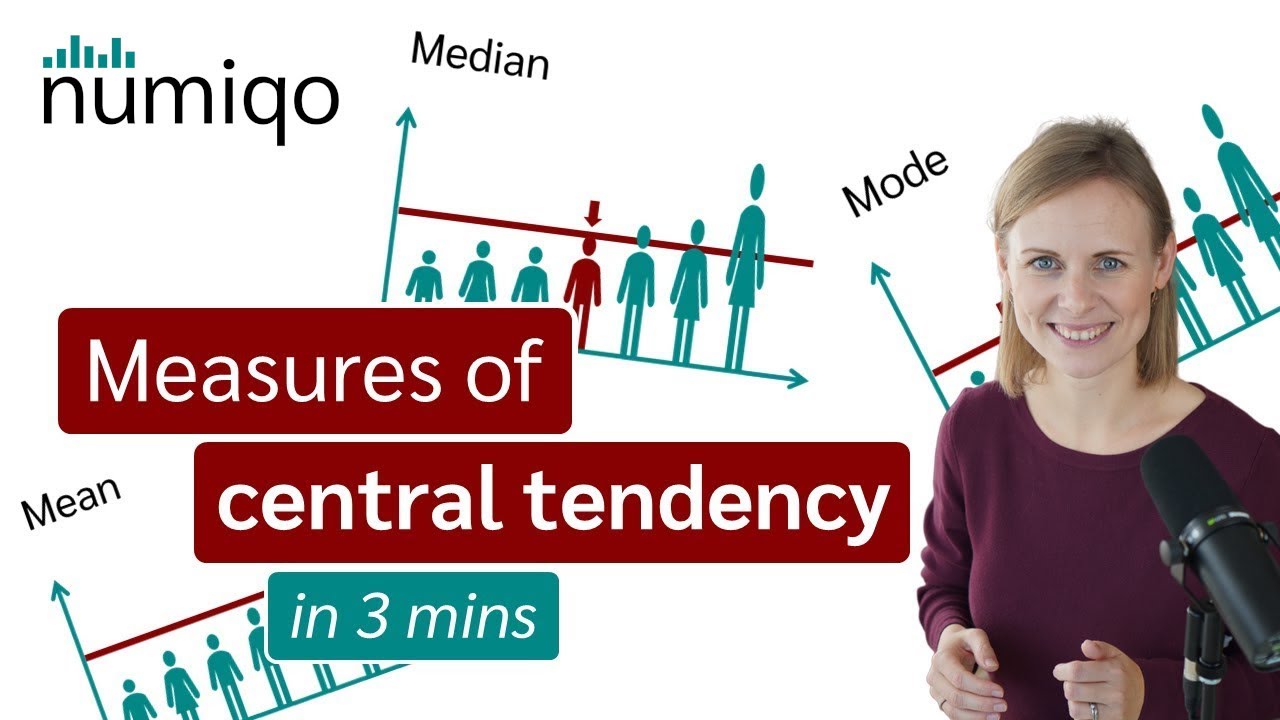
An Average Video | Mean, Median, Mode, and Range
TLDRIn this two-minute classroom video, the presenter discusses the concept of averages, focusing on mean, median, and mode as central values in data sets. The mean is calculated by summing all values and dividing by the number of data points, while the mode is the most frequently occurring number, which can be singular or multiple. The median is the middle value, either a single number or the average of two middle numbers in an ordered set. The video also touches on the range, which measures data spread but isn't an average. The presenter provides clear examples and encourages viewers to visit their website for more resources, aiming to clarify and enhance understanding of averages.
Takeaways
- 📚 An average is a central or typical value in a set of data, including mean, median, and mode.
- 🔢 To find the mean, sum all numbers in a dataset and divide by the total count of data points.
- 📈 Ordering numbers from least to greatest is a good practice, though not necessary for calculating the mean.
- 📉 The mode is the most frequently occurring number in a dataset, and there can be no mode or multiple modes.
- 📊 The median is the middle value in an ordered dataset; if even-numbered, it's the mean of the two middle numbers.
- 📝 The range is the difference between the highest and lowest values and indicates data spread, but it's not an average.
- 👉 For an even set of data, the median is calculated by averaging the two central numbers.
- 🔍 Finding the mode is straightforward when numbers are ordered, as it's the repeated number or numbers.
- 📉 If no number repeats in a dataset, it is said to have no mode.
- 📚 The script provides a quick recap to help remember the definitions and calculations of mean, mode, median, and range.
- 📚 Additional resources for understanding averages can be found on the instructor's website.
Q & A
What is an average and why is it significant in data analysis?
-An average refers to a central or typical value in a set of data, which can include the mean, median, and mode. It is significant because it helps summarize and describe the data, providing a single value that represents the whole set.
What is the mean and how is it calculated?
-The mean is the most common average and is calculated by summing all the values in a data set and then dividing by the total number of values. It represents the average value of the data set.
Why is it a good practice to order numbers from least to greatest when finding an average?
-Ordering numbers from least to greatest is a good practice because it helps in visualizing the data and identifying patterns, although it is not strictly necessary for calculating the mean.
What is the mode in a data set and how can you find it?
-The mode is the number that occurs most frequently in a data set. To find the mode, you would order the numbers and identify the value that appears most often.
Can a data set have no mode? If so, under what condition?
-Yes, a data set can have no mode if every number appears only once, meaning there are no repeat values.
What happens if a data set has multiple modes?
-If a data set has multiple modes, it means there are two or more numbers that occur with the same highest frequency.
What is the median and how do you find it?
-The median is the middle value of a data set when the numbers are ordered from least to greatest. If there is an odd number of values, the median is the middle number. If there is an even number of values, the median is the mean of the two middle numbers.
How does the process of finding the median differ for an even number of data points?
-For an even number of data points, the median is calculated by taking the mean of the two middle numbers in the ordered set, rather than a single middle value.
What is the range of a data set and how is it found?
-The range of a data set is the difference between the highest and lowest values. It is found by subtracting the lowest value from the highest value and indicates how spread out the data is.
How can the range help in understanding the data set?
-The range helps in understanding the dispersion or spread of the data set by showing the difference between the maximum and minimum values.
What is the purpose of the quick recap provided in the video?
-The quick recap serves to reinforce the understanding of the concepts of mean, mode, median, and range, summarizing the key points for easier recall and comprehension.
Outlines
📚 Introduction to Averages
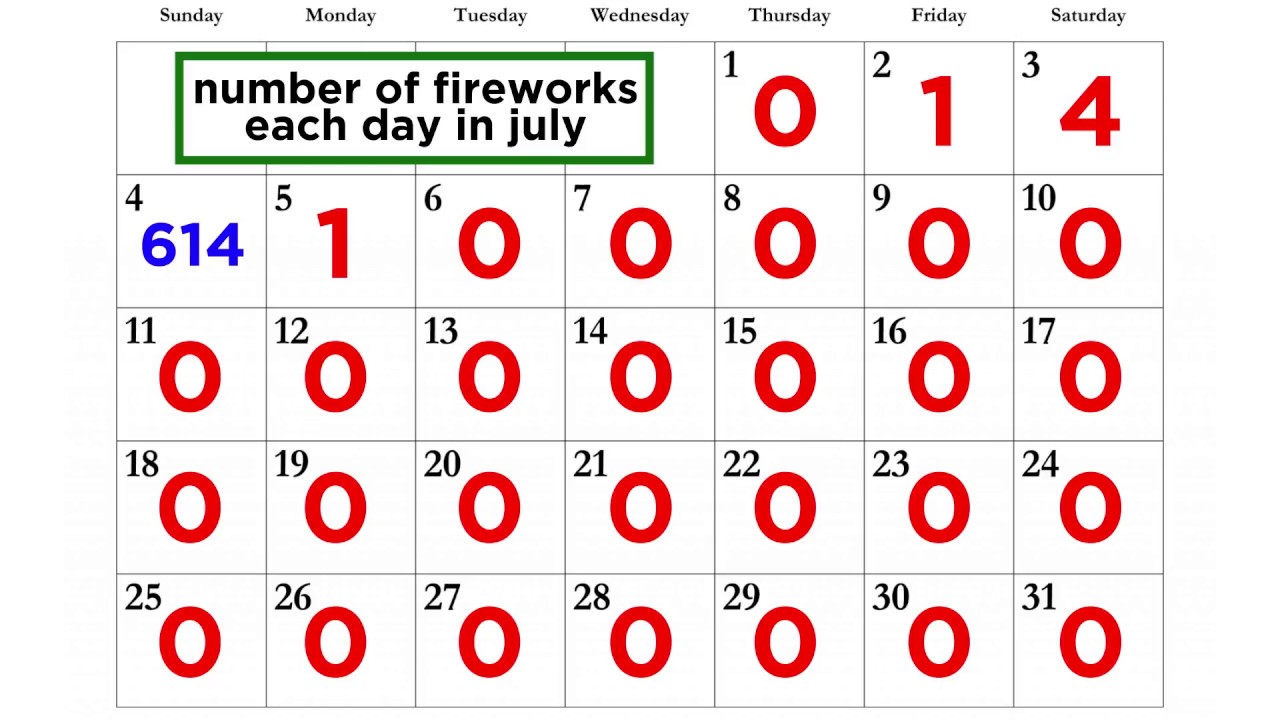
The video introduces the concept of averages, including mean, median, and mode, and provides a link to the instructor's website for additional resources. The mean is explained as the most common average and is calculated by summing all data points and dividing by the total number of points. An example using test scores is given, where the sum is divided by the number of scores to find the mean. The mode is described as the most frequently occurring number in a set, with an example where 75 is the mode because it appears more than once. The median is explained as the middle value in a numerically ordered set, with a method to find it provided, which involves taking the mean of the two middle numbers if there is an even number of values. The video also mentions the range, which is the difference between the highest and lowest values, as a measure of data spread, but clarifies that it is not an average. A recap of the definitions and calculations for mean, mode, median, and range is provided, and viewers are encouraged to comment on their understanding and to explore more videos or visit the website.
Mindmap
Keywords
💡Averages
💡Mean
💡Mode
💡Median
💡Range
💡Data Set
💡Central Tendency
💡Ordering Data
💡Decimals
💡Rounding Off
💡Numerically Ordered
Highlights
Introduction to the concept of averages including mean, median, and mode.
Mean is the most common average and is calculated by summing all values and dividing by the number of data points.
Ordering numbers from least to greatest is a good practice when finding an average, especially for the mean.
Mode is the most frequently occurring number in a data set, and it can be found after numerically ordering the data.
A data set can have no mode if every number appears only once.
A data set can have multiple modes if there are several numbers that repeat with the highest frequency.
Median is the middle value of a numerically ordered data set and can be found by counting from the outside in.
If there is an even number of values, the median is calculated by averaging the two middle numbers.
An example is given to illustrate the calculation of the median with the numbers seven and nine.
Range is mentioned as a measure of spread in data, though it is not an average.
Range is calculated by subtracting the lowest value from the highest value in a data set.
Recap of the definitions of mean, mode, median, and range to aid in understanding and retention.
Mean is defined as the sum of all values divided by the total number of values.
Mode is described as the most frequent value, which can be absent or multiple in a data set.
Median is defined as the middle value of an ordered data set.
An invitation for viewers to comment on their understanding of averages and the video's effectiveness.
A prompt to check out other videos or visit the website for more information on averages.
Closing remarks with an indication of future content in the series.
Transcripts
Browse More Related Video
Finding mean, median, and mode | Descriptive statistics | Probability and Statistics | Khan Academy
Math Antics - Mean, Median and Mode

Finding Mean, Median, and Mode | Math with Mr. J
Analyzing Sets of Data: Range, Mean, Median, and Mode
Mean, Median, Mode, and Range | Math with Mr. J
Mean, Median and Mode - Measures of Central Tendency
5.0 / 5 (0 votes)
Thanks for rating: