Expected Value: E(X)
TLDRThis video script delves into the concept of central tendencies, specifically the population mean and its calculation through arithmetic. It illustrates the process using a set of numbers and then transitions into discussing the expected value of a random variable, highlighting the connection between population mean and expected value. The script clarifies that even with infinite populations, expected values can be determined using relative frequencies, as demonstrated with a probability distribution example of tossing a coin six times. The video aims to solidify the understanding of expected value as an extension of the population mean concept, applicable even to scenarios involving random variables with infinite outcomes.
Takeaways
- 🧮 The arithmetic mean is calculated by adding all numbers in a set and dividing by the count of numbers.
- 📊 The population mean is the average of all elements in a population, and it can be represented in different mathematical forms.
- 🔢 In the given example, the population mean of the numbers 3, 3, 3, 4, and 5 is calculated to be 3.6.
- 📚 The concept of a population and a sample is essential in statistics, where a sample is used to estimate population parameters.
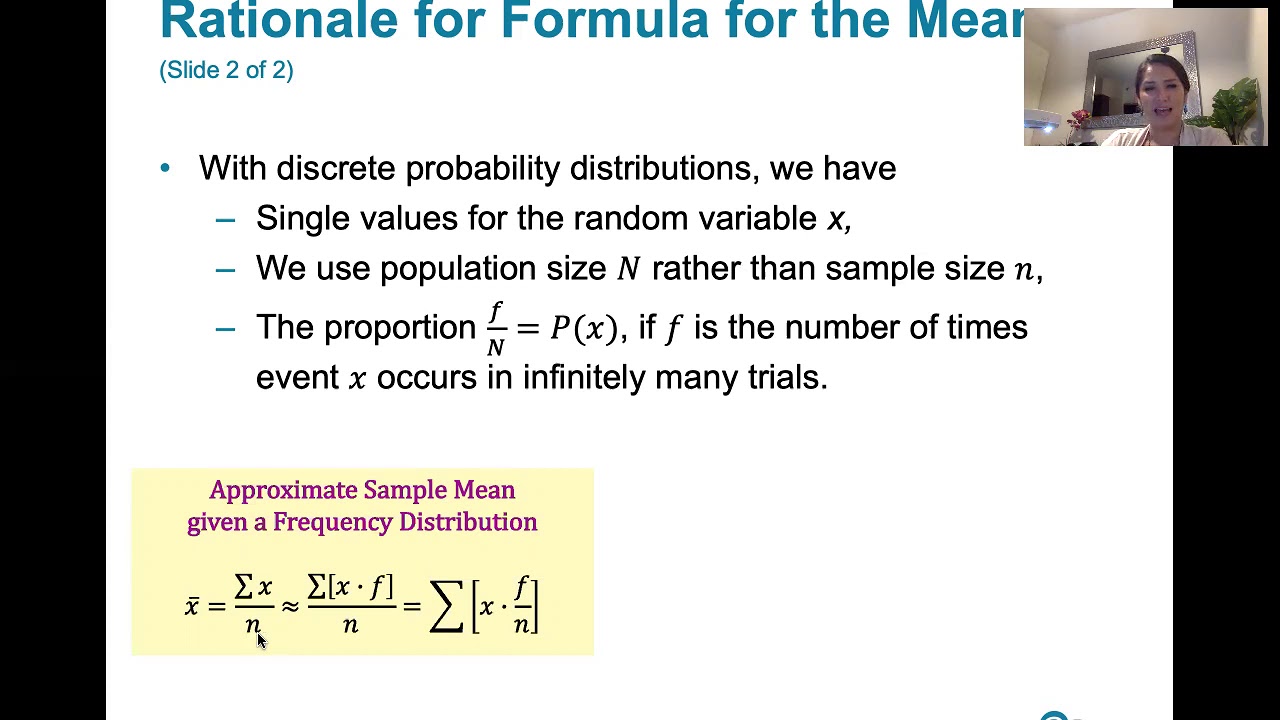
- 🔄 The script demonstrates a method to calculate the mean by using the frequency of numbers rather than the total count.
- 🎲 The idea of a random variable is introduced, which can represent an infinite number of outcomes, such as the number of heads in coin tosses.
- 🚀 The expected value of a random variable is analogous to the population mean, but it applies to scenarios with infinite populations.
- 📈 The expected value is calculated by multiplying each outcome by its relative frequency and summing these products.
- 📊 The script connects the concepts of probability distributions to the calculation of expected values, showing how they can be determined from such distributions.
- 🔢 The example of a fair coin toss illustrates that the expected value of getting heads in 6 tosses is 3, which is the average outcome.
- 🔄 The script emphasizes that the expected value does not necessarily equate to the most probable outcome in a distribution.
Q & A
What is the arithmetic mean and how is it calculated for a given population?
-The arithmetic mean is a measure of central tendency that represents the average value of a set of numbers. It is calculated by summing all the numbers in the population and then dividing by the count of those numbers. For example, if the population consists of the numbers 3, 3, 3, 4, and 5, the mean is calculated as (3+3+3+4+5)/5, which equals 3.6.
How can the population mean be expressed using the frequency of numbers in the population?
-The population mean can be expressed by multiplying each unique number by its frequency and then dividing by the total number of observations. For instance, if there are three 3's, one 4, and one 5, the mean can be calculated as (3 * 3 + 1 * 4 + 1 * 5) / 5, which simplifies to 3.6.
What is the difference between a population and a sample in statistics?
-A population in statistics refers to the entire set of individuals or items of interest for a study, while a sample is a subset of the population that is used to represent and make inferences about the population. For example, the entire electorate in a country is a population, whereas a survey of a portion of the electorate would be a sample.
What is the concept of a random variable in the context of statistics?
-A random variable is a variable that can take on different values each time an experiment is conducted. It is used to represent the outcome of a random phenomenon, such as the number of heads obtained after tossing a coin a certain number of times.
How is the expected value of a random variable related to the population mean?
-The expected value of a random variable is essentially the population mean of the infinite set of possible outcomes that the random variable can take. It is calculated by multiplying each outcome by its probability and summing these products, which gives the average outcome over an infinite number of experiments.
Why is the concept of expected value important when dealing with infinite populations?
-The concept of expected value is important because it allows us to calculate an average outcome for a random variable with an infinite number of possible outcomes. Since we cannot sum an infinite number of data points, we use the relative frequencies or probabilities of each outcome to find the average.
What is the connection between the expected value and the arithmetic mean of a finite population?
-The expected value and the arithmetic mean of a finite population are conceptually the same; both are measures of central tendency. The expected value is essentially the arithmetic mean applied to an infinite population, where the sum of all outcomes is not feasible, so we use probabilities instead.
How can you represent the population mean using percentages of each number in the population?
-You can represent the population mean using percentages by multiplying each number by its corresponding percentage and then summing these products. For example, if 60% of the numbers are 3, 20% are 4, and 20% are 5, the mean is calculated as (0.6 * 3) + (0.2 * 4) + (0.2 * 5), which equals 3.6.
What is the significance of knowing the frequency or probability distribution of outcomes in calculating the expected value?
-Knowing the frequency or probability distribution of outcomes is crucial for calculating the expected value because it allows us to weight each outcome by its likelihood of occurring. This is especially important for infinite populations, where we cannot simply sum all possible outcomes.
Can the expected value of a random variable be different from the most probable outcome?
-Yes, the expected value of a random variable can be different from the most probable outcome. The expected value is calculated by considering the weighted average of all possible outcomes based on their probabilities, which may not align with the single most likely outcome.
How does the video script illustrate the concept of expected value using the example of tossing a fair coin?
-The script illustrates the concept of expected value by showing how to calculate the average number of heads after tossing a fair coin six times. It uses the probabilities of getting 0 to 6 heads to calculate the expected value, demonstrating that even with an infinite number of possible outcomes, we can determine a central tendency.
Outlines
📊 Understanding Arithmetic Mean and Central Tendency
This paragraph introduces the concept of the arithmetic mean, which is calculated by summing a set of numbers and dividing by the count of numbers. The example given is a population consisting of three 3's, a 4, and a 5, resulting in a mean of 3.6. The explanation then explores different ways to express the mean, such as multiplying the frequency of each number by the number itself and dividing by the total count, which leads to the same result. The paragraph also touches on the idea of using percentages to calculate the mean, emphasizing the importance of knowing the total number of data points in a population.
🔍 Transitioning from Finite to Infinite Populations and Random Variables
The second paragraph delves into the challenges of calculating the mean for an infinite population, such as the outcomes of an experiment that can be repeated indefinitely, like tossing a coin multiple times. It contrasts this with the finite population mean calculation and introduces the concept of a random variable, which represents the outcome of such an experiment. The paragraph explains that even with an infinite number of possible outcomes, one can calculate the expected value or mean by understanding the frequency or probability of each outcome, using the example of the number of heads after six coin tosses.
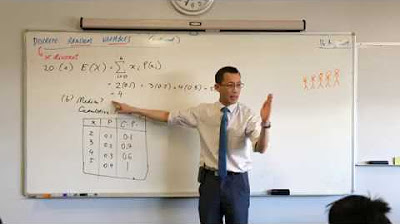
🎲 Calculating Expected Value of a Random Variable
The final paragraph focuses on the calculation of the expected value of a random variable, which is analogous to the population mean but applied to scenarios with infinite outcomes. Using the example of the number of heads after six coin tosses, the paragraph demonstrates how to calculate the expected value by multiplying each possible outcome by its probability of occurrence and summing these products. The result is an expected value of 3, which is the average number of heads one would expect over many such experiments. The paragraph also clarifies that the expected value is not necessarily the most probable outcome, setting the stage for further exploration of this concept.
Mindmap
Keywords
💡Central Tendencies
💡Arithmetic Mean
💡Population Mean
💡Sample Mean
💡Random Variable
💡Probability Distribution
💡Expected Value
💡Relative Frequency
💡Infinite Population
💡Experiment
💡Frequency
Highlights
Introduction to the concept of central tendencies and the arithmetic mean.
Explanation of calculating the population mean by adding numbers and dividing by their count.
Demonstration of alternative mathematical expressions for calculating the mean.
Illustration of calculating mean using frequency distribution instead of total count.
Conversion of frequency-based mean calculation into percentage terms.
Connection between the concept of population mean and the idea of random variables.
Discussion on the difference between finite and infinite populations in statistics.
Introduction to the concept of expected value for a random variable.
Explanation of calculating expected value using the frequency of outcomes.
Use of discrete probability distribution to determine the frequency of outcomes.
Calculation of expected value for the number of heads in 6 coin tosses.
Illustration of summing up weighted outcomes to find the expected value.
Clarification that the expected value may not always be the most probable outcome.
Highlighting the equivalence between the expected value calculation and the population mean.
Emphasis on understanding the principles behind expected value calculation as opposed to memorizing formulas.
Transcripts
Browse More Related Video

Expected value of binomial distribution | Probability and Statistics | Khan Academy
5.1.3 Discrete Probability Distributions - Finding the Mean, Variance, and Standard Deviation

5.1.0 Discrete Probability Distributions - Lesson Overview and Learning Outcomes
Discrete Random Variables (1 of 3: Expected value & median)

5.1.6 Discrete Probability Distributions - Expected Value and Decision Theory

Elementary Statistics - Chapter 5 Probability Distributions Part 1
5.0 / 5 (0 votes)
Thanks for rating: