Math Antics - Mean, Median and Mode
TLDRIn this Math Antics lesson, Rob introduces the concepts of Mean, Median, and Mode as essential tools for understanding data sets. He explains that the Mean, or average, is calculated by adding all numbers in a set and dividing by the count, offering a general sense of the data. The Median is the middle value when a set is ordered, offering a more focused view. The Mode is the most frequently occurring number in a set. Through examples, Rob demonstrates how these measures provide different perspectives on data, aiding in analysis and interpretation.
Takeaways
- 📊 The Mean (or average) is calculated by adding all numbers in a data set and dividing by the count of numbers.
- 🔢 To find the Median, arrange the data set in numerical order and identify the middle value; for an even number of values, average the two middle numbers.
- 🔡 The Mode is the number that appears most frequently in a data set, and a set can have more than one mode.
- 🧩 Data sets can be collections of numbers from various sources like scientific measurements or survey results.
- 📈 Mean, Median, and Mode provide simplified insights into data sets, helping to understand the overall picture.
- 🔍 To calculate the Mean, sum all values and divide by the number of values, as demonstrated with a family's ages and a set of numbers.
- 📊 Median calculation requires ordering the data set, with adjustments made for even-numbered sets by averaging the central values.
- 📈 The script provides a real-world example of calculating Mean, Median, and Mode for monthly guitar sales.
- 🎓 Understanding and differentiating between Mean, Median, and Mode is crucial for data analysis.
- 💡 Remembering 'Mean' as 'average', 'Median' as 'middle', and 'Mode' as 'Most Often' can aid in recalling their definitions.
- 🚀 Practice is essential for mastering mathematical concepts like Mean, Median, and Mode.
Q & A
What are the three important math concepts discussed in the script?
-The three important math concepts discussed are the Mean, the Median, and the Mode.
What is a data set in the context of math?
-A data set is a collection or group of numbers, which may come from scientific measurements, surveys, or other data collection methods.
What does the Mean represent in a data set?
-The Mean represents the average of a data set, providing a single value that, if each number in the set could be made the same, would be that consistent value.
How is the Mean calculated mathematically?
-To calculate the Mean, you add up all the numbers in the set and then divide the total by the number of values in the set.
What is the Median and how does it relate to a data set?
-The Median is the middle value of a data set when the numbers are arranged in ascending or descending order. It splits the data set into two halves with one half containing values less than or equal to the Median, and the other half containing values greater than or equal to the Median.
How do you find the Median if the data set has an even number of values?
-If the data set has an even number of values, you find the two middle numbers, calculate their Mean (average), and that value is the Median.
What is the Mode of a data set?
-The Mode is the value that occurs most frequently in a data set. A data set can have one Mode, more than one Mode, or no Mode at all if all values occur equally.
How can the Mean, Median, and Mode be used to understand a data set?
-These three properties provide different perspectives on the data set. The Mean gives an overall average, the Median shows the middle value, and the Mode indicates the most common value. Together, they help to understand the central tendency and distribution of the data.
Why is it important to understand the differences between Mean, Median, and Mode?
-Understanding the differences is crucial because each measure provides unique insights into the data set. The Mean is affected by outliers, the Median is more robust to extreme values, and the Mode shows frequency. Knowing these can lead to more accurate interpretations of data.
How can you remember the difference between Mean, Median, and Mode?
-You can remember them with the following associations: 'Mean' means 'average', 'Median' is in the 'middle', and 'Mode' starts with 'M' and 'O', reminding you of 'Most Often'.
What is the real-world example given in the script to demonstrate Mean, Median, and Mode?
-The real-world example is about a person who makes and sells custom electric guitars, and the data set shows the number of guitars sold each month of the year.
What are the calculated values for Mean, Median, and Mode for the custom electric guitar sales data set?
-The Mean is 9 guitars sold per month, the Median is 9.5 guitars sold, and the Mode is 10 guitars sold.
Outlines
📊 Introduction to Mean, Median, and Mode
This paragraph introduces the viewer to three fundamental concepts in mathematics: the Mean, the Median, and the Mode. It explains that these concepts are used to understand and analyze data sets, which can range from simple collections of numbers, like family ages or pet weights, to complex data like store inventory or mammal speeds. The Mean is introduced as another term for the average, and a visual example using blocks is provided to illustrate how to find the Mean. The paragraph emphasizes the usefulness of these properties in making sense of large data sets.
📈 Calculating the Mean and Understanding the Median
The paragraph delves into the mathematical procedure for calculating the Mean, using both a visual example with blocks and a step-by-step mathematical explanation. It contrasts the Mean with the Median, explaining that the Median is the middle value in a data set when the numbers are ordered. The paragraph also addresses what to do when a data set has an even number of values, showing how to find the Median by averaging the two middle numbers. Examples are provided to clarify the difference between the Mean and Median, and the concept is reinforced with a real-world scenario involving a family's ages.
🔢 Determining the Mode and Applying Mean, Median, and Mode to Real-World Data
This paragraph introduces the Mode as the value that occurs most frequently in a data set. It differentiates the Mode from the Mean and Median by providing an example data set with repeated values and explaining how to identify the Mode. The paragraph then applies the concepts of Mean, Median, and Mode to a real-world example of monthly guitar sales, showing how to calculate each property and what they reveal about the data. The paragraph concludes with a reminder of the importance of practice in mastering these mathematical concepts and encourages viewers to apply what they've learned.
Mindmap
Keywords
💡Mean
💡Median
💡Mode
💡Data Set
💡Addition
💡Division
💡Blocks
💡Order
💡Electric Guitars Sales
💡Practice
💡Math Antics
Highlights
Introduction to Mean, Median, and Mode as key concepts in understanding data sets.
Mean is another term for the average of a data set, providing a single value that represents the entire set.
Visual representation of data sets using blocks to illustrate the concept of Mean.
Mathematical procedure for calculating the Mean: sum all numbers and divide by the count.
Median as the middle value of a data set, dividing it into two halves.
Explanation of how to find the Median when the data set is not ordered.
Difference between Mean and Median in a data set, and how they can vary.
Mode defined as the value that occurs most frequently in a data set.
Example of a data set with more than one mode when values are repeated with the same frequency.
Practical application of Mean, Median, and Mode on a real-world data set of electric guitar sales.
Step-by-step calculation of Mean, Median, and Mode for the electric guitar sales data set.
Explanation of how to handle even-numbered data sets for Median calculation.
Importance of practice in mastering the concepts of Mean, Median, and Mode.
Mnemonic for remembering the concepts: Mean is average, Median is middle, and Mode occurs Most Often.
Encouragement to practice finding Mean, Median, and Mode on one's own to improve math skills.
Conclusion and invitation to learn more at Math Antics' website.
Transcripts
Browse More Related Video
Finding mean, median, and mode | Descriptive statistics | Probability and Statistics | Khan Academy
Finding Mean, Median, and Mode | Math with Mr. J
An Average Video | Mean, Median, Mode, and Range
Mean, Median, Mode, and Range | Math with Mr. J
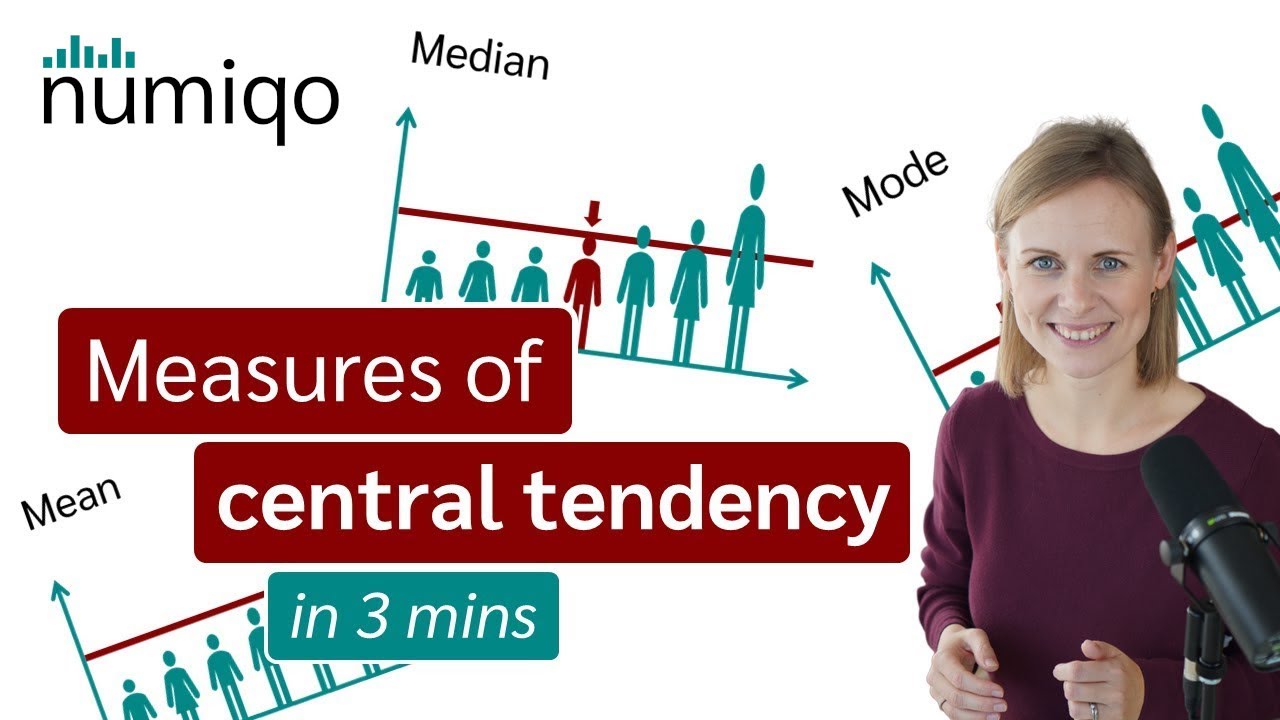
Mean, Median and Mode - Measures of Central Tendency
Statistics intro: Mean, median, and mode | Data and statistics | 6th grade | Khan Academy
5.0 / 5 (0 votes)
Thanks for rating: