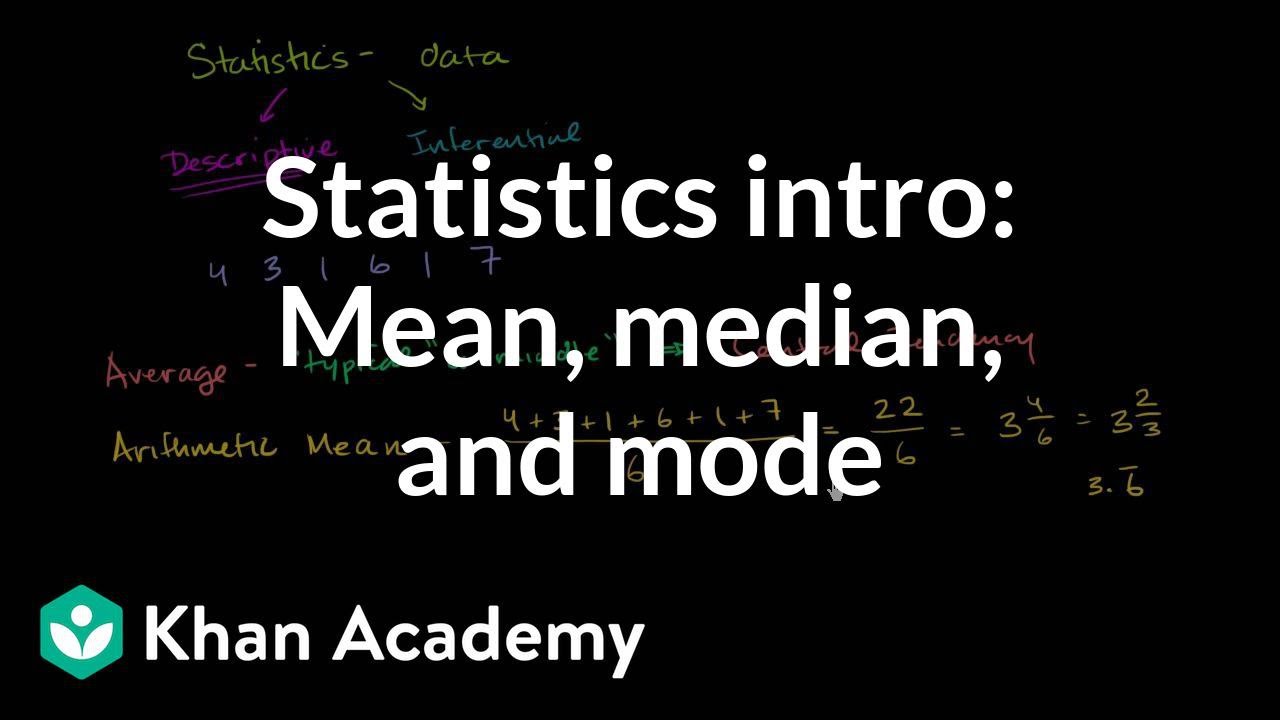
Finding mean, median, and mode | Descriptive statistics | Probability and Statistics | Khan Academy
TLDRThe video script provides a detailed explanation of three measures of central tendency: mean, median, and mode. The mean is calculated by summing all numbers in a data set and dividing by the count of numbers, resulting in an average that represents the central tendency. In this example, the mean is found to be 25.75. The median is the middle value when numbers are ordered from least to greatest; with an even number of data points, the median is the average of the two middle numbers, which in this case is 24. Lastly, the mode is the most frequently occurring number in a data set, and for the given numbers, the mode is 23, as it appears twice while all other numbers appear only once. The script emphasizes that these measures offer different perspectives on the 'middle' of a data set, and there is no single 'correct' method to represent it.
Takeaways
- 🧮 The mean is calculated by summing all numbers and dividing by the count of numbers.
- 📊 The median is the middle number in a sorted list of numbers and is a measure of central tendency.
- 🔢 If there is an even number of data points, the median is the average of the two middle numbers.
- 📈 The mode is the number that appears most frequently in a data set.
- 🌟 The mean, median, and mode are all measures used to represent the center of a data set.
- ⚖️ The mean is sometimes referred to as the arithmetic mean and is a common way to find an average.
- 📋 To find the median, numbers must be ordered from least to greatest.
- 🔁 The mode is the most repeated number in the data set, and there can be more than one mode if multiple numbers appear with the same highest frequency.
- 🧐 The script illustrates the process of calculating the mean, median, and mode using a specific set of numbers.
- 📉 The mean can be influenced by extreme values (outliers), while the median is less affected by them.
- 📚 Understanding the mean, median, and mode is essential for statistical analysis and interpreting data.
Q & A
What does the term 'mean' refer to in the context of the script?
-In the script, 'mean' refers to the average value of a set of numbers, which is calculated by summing all the numbers and then dividing by the count of numbers present.
What is another name for the mean mentioned in the script?
-The mean is sometimes called the arithmetic mean because there are other methods of calculating a mean, such as the geometric mean or the harmonic mean.
How is the mean calculated for the given set of numbers?
-The mean is calculated by adding all the numbers together (23, 29, 20, 32, 23, 21, 33, 25) to get a sum of 206, and then dividing that sum by the total count of numbers, which is 8, resulting in a mean of 25.75.
What is the median and how is it determined for an even number of data points?
-The median is the middle number in a sorted, ascending or descending, list of numbers. For an even number of data points, the median is the average of the two middle numbers. In the script, the two middle numbers are 23 and 25, and their average is 24, so the median is 24.
What is the mode in the given set of numbers?
-The mode is the number that appears most frequently in a data set. In the script, the number 23 appears twice, more often than any other number, making it the mode.
Why is the median not simply the number 24 from the data set?
-The median is not the number 24 because it is not one of the original numbers in the data set. The median is calculated by averaging the two middle numbers when the data set has an even number of values. In this case, the two middle numbers are 23 and 25, and their average is 24.
What is central tendency and why is it important?
-Central tendency is a measure that describes the center point of a data set. It is important because it provides a single value that can represent the entire data set, which is useful for summarizing and comparing different sets of data.
What are the different ways to measure the central tendency mentioned in the script?
-The script mentions three ways to measure the central tendency: the mean (average), the median (middle number), and the mode (most frequent number).
Why might the mean not always be the best measure of central tendency?
-The mean might not always be the best measure of central tendency because it is sensitive to outliers or extreme values, which can skew the average and not accurately represent the typical value within the data set.
How does the script differentiate between the mean, median, and mode?
-The script differentiates between the mean, median, and mode by explaining how each is calculated and providing the specific values for the given set of numbers: the mean is 25.75, the median is 24, and the mode is 23.
What is the significance of ordering numbers from least to greatest when finding the median?
-Ordering numbers from least to greatest is significant for finding the median because it allows for the identification of the middle number or numbers in the data set, which is essential for calculating the median accurately.
Can the mode represent the middle of a data set?
-The mode does not represent the middle of a data set; it represents the most frequently occurring value. It is the mean and median that are typically used to represent the middle or central tendency of a data set.
Outlines
📊 Understanding Mean, Median, and Mode
This paragraph introduces the concepts of mean, median, and mode as measures of central tendency for a set of numbers. The mean is calculated by summing all numbers and dividing by the count, which in this case results in 25.75. The median is found by ordering the numbers and averaging the two middle numbers, which gives us 24. The mode is the most frequently occurring number, which is 23 in this dataset. The explanation emphasizes that these are different ways to represent the 'middle' of a data set.
Mindmap
Keywords
💡Mean
💡Median
💡Mode
💡Central Tendency
💡Arithmetic Mean
💡Summation
💡Ordered List
💡Even and Odd Number of Data Points
💡Data Set
💡Calculator
💡Statistical Measures
Highlights
Mean is referred to as the average in everyday language and is calculated by summing all numbers and dividing by the count.
Arithmetic mean is one way of measuring central tendency.
To find the mean, sum all the numbers in the dataset and divide by the number of numbers.
The sum of the provided numbers is 206.
Dividing the sum by 8 gives a mean of 25.75.
Median is the middle number in a dataset when ordered from least to greatest.
For an even number of data points, the median is the average of the two middle numbers.
The median of the provided dataset is 24, calculated by averaging the two middle numbers 23 and 25.
Mode is the number that appears most frequently in a dataset.
In the given dataset, the number 23 is the mode as it appears twice, more than any other number.
All other numbers in the dataset appear only once.
There is no one definitive way to represent the middle of a dataset; mean, median, and mode are different measures.
Mean, median, and mode are all methods to represent the central tendency of a dataset.
The dataset provided consists of eight numbers: 20, 21, 23, 23, 25, 29, 32, and 33.
The mean, median, and mode are all calculated based on the ordered dataset.
The process of finding the mean, median, and mode provides a comprehensive understanding of the dataset's central tendency.
The mean, median, and mode are essential statistical measures for analyzing and interpreting data.
Understanding the calculation and significance of mean, median, and mode is crucial for data analysis.
Transcripts
Browse More Related Video
An Average Video | Mean, Median, Mode, and Range
Math Antics - Mean, Median and Mode
Finding Mean, Median, and Mode | Math with Mr. J
Mean, Median, Mode, and Range | Math with Mr. J
Statistics intro: Mean, median, and mode | Data and statistics | 6th grade | Khan Academy
Mean, Median and Mode - Measures of Central Tendency
5.0 / 5 (0 votes)
Thanks for rating: