How To Calculate The Standard Deviation of Grouped Data
TLDRThis educational video script guides viewers through calculating the standard deviation of grouped data, using a class of students' exam scores as an example. It explains the process of finding midpoints for class ranges, calculating the mean, and then using the formula for standard deviation with grouped data. The script provides a step-by-step method, including multiplying frequencies by midpoints, finding deviations, squaring them, and finally computing the standard deviation, which is approximately 12.3 for the given data set.
Takeaways
- 📚 The video discusses calculating the standard deviation of group data, specifically student exam scores categorized by grade ranges.
- 🔢 The first step is to determine the midpoint of each grade range, which is the average of the lower and upper boundaries of the range.
- ⚖️ The midpoints are used to represent the average score within each range, assuming all scores are whole numbers.
- 📈 The next step is to multiply the frequency of each grade range by its respective midpoint to find a weighted sum.
- 🧮 To find the mean (average) score, sum the product of frequencies and midpoints, then divide by the total number of students.
- 📉 The formula for standard deviation is modified for group data, involving the sum of the square of deviations multiplied by frequency, divided by n-1.
- 📝 Calculate the deviations by subtracting the mean from each midpoint, then square these deviations.
- 📊 Multiply the squared deviations by the frequency of each range to find the sum of squared deviations.
- 🔑 The standard deviation is then the square root of the sum of squared deviations divided by n-1.
- 📉 The mean in this example is calculated to be approximately 79.2, which makes sense given the distribution of scores.
- 📊 The final calculated standard deviation for the grouped frequency data is approximately 12.3.
Q & A
What is the main topic of the video?
-The video is about calculating the standard deviation of grouped data, specifically using a class of students' exam scores as an example.
What are the grade ranges provided in the video?
-The grade ranges are 50-59 for an F, 60-69 for a D, 70-79 for a C, and so on, with the highest range being 90-100.
How is the midpoint of a class range calculated?
-The midpoint of a class range is calculated by averaging the lower and upper boundaries of the range, which is done by adding them up and dividing by two.
Why are the student scores considered to be rounded to whole numbers in this problem?
-The student scores are considered to be rounded to whole numbers because scores like 69.5 do not fit into the given class ranges, so it is assumed that all scores are integer values.
What is the formula used to calculate the standard deviation for grouped data?
-The formula used for grouped data is the square root of the sum of the square of the deviations (frequency times the difference between the midpoint and the mean, squared) divided by n minus 1, where n is the number of data values.
How is the mean calculated for grouped data?
-The mean for grouped data is calculated by summing the frequency times the midpoint values and then dividing by the sum of the frequency values, which equals the total number of data values.
What is the calculated mean of the students' scores in the video?
-The calculated mean of the students' scores is approximately 79.2.
What is the purpose of calculating the difference between the midpoint and the mean?
-The purpose of calculating the difference between the midpoint and the mean is to find the deviation of each class from the overall mean, which is then used to calculate the standard deviation.
How are the deviations squared and multiplied by the frequency in the calculation process?
-The deviations are squared to remove any negative signs and then multiplied by the frequency of each class to find the weighted sum of the squared deviations.
What is the final calculated standard deviation for the grouped frequency data in the video?
-The final calculated standard deviation for the grouped frequency data is approximately 12.3.
Why is the number of data values (n) subtracted by one in the standard deviation formula for grouped data?
-The number of data values (n) is subtracted by one in the formula to account for the degrees of freedom in the sample, which is a common practice in statistical calculations to estimate the population standard deviation.
Outlines
📚 Introduction to Calculating Standard Deviation from Grouped Data
This paragraph introduces the process of calculating the standard deviation for a set of student grades grouped into classes with specific ranges and frequencies. The video explains the importance of first determining the midpoint of each class range, such as averaging 50 and 59 to get 54.5, and then using these midpoints to calculate the mean of the data set. It also outlines the formula for standard deviation, which is adjusted for grouped data by squaring the deviations between the midpoints and the mean, and then dividing by the number of data values minus one.
🔢 Calculating the Mean and Preparing for Standard Deviation Calculation
The second paragraph details the steps to calculate the mean of the grouped data, which involves multiplying the frequency of each grade range by its respective midpoint and then dividing by the total number of students. The mean is found to be approximately 79.2 after rounding. The paragraph also describes the next steps in the standard deviation calculation, which include finding the difference between each midpoint and the mean, squaring these differences, and then multiplying by the frequency to prepare for the final standard deviation formula.
📉 Completing the Standard Deviation Calculation for Grouped Data
In the final paragraph, the process of calculating the standard deviation is completed. This involves summing the products of the squared deviations and their respective frequencies, and then dividing by the total number of data points minus one. The result is then squared to find the standard deviation, which is approximately 12.3 for the given data set. The paragraph emphasizes the tedious nature of this calculation without the aid of tools like Excel or calculators and concludes with the final standard deviation value.
Mindmap
Keywords
💡Standard Deviation
💡Group Data
💡Midpoint
💡Frequency
💡Mean
💡Deviation
💡Sum of Squares
💡Integer Values
💡Rounded
💡Formula
💡Contextual Application
Highlights
Introduction to calculating standard deviation for grouped data.
Explanation of class ranges and corresponding grades.
Description of frequency column indicating student scores.
Method to determine midpoints of class ranges.
Calculation of midpoints for each grade range.
Assumption of integer values for student scores.
Formula for calculating standard deviation with group data.
Modification of standard deviation formula for grouped data.
Calculation of mean from frequency and midpoint values.
Explanation of the sum of frequency values equaling the total number of data values.
Multiplication of frequency by midpoint to find sum for mean calculation.
Mean calculation and its significance in relation to data distribution.
Process of finding deviations from the mean for each midpoint.
Squaring of deviations to prepare for standard deviation calculation.
Multiplication of frequency by squared deviations.
Summation of frequency times squared deviations for standard deviation formula.
Final calculation of standard deviation for grouped frequency data.
Conclusion and summary of the standard deviation calculation process.
Transcripts
Browse More Related Video
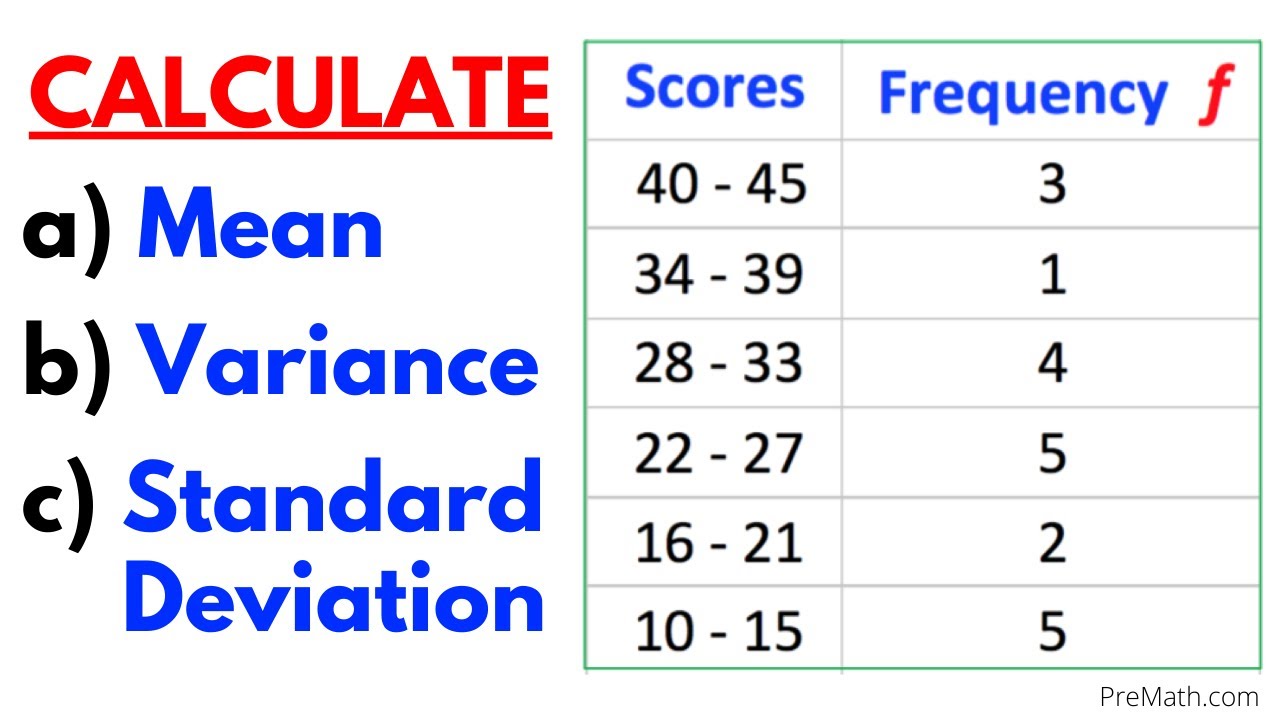
Find the Mean, Variance, & Standard Deviation of Frequency Grouped Data Table| Step-by-Step Tutorial
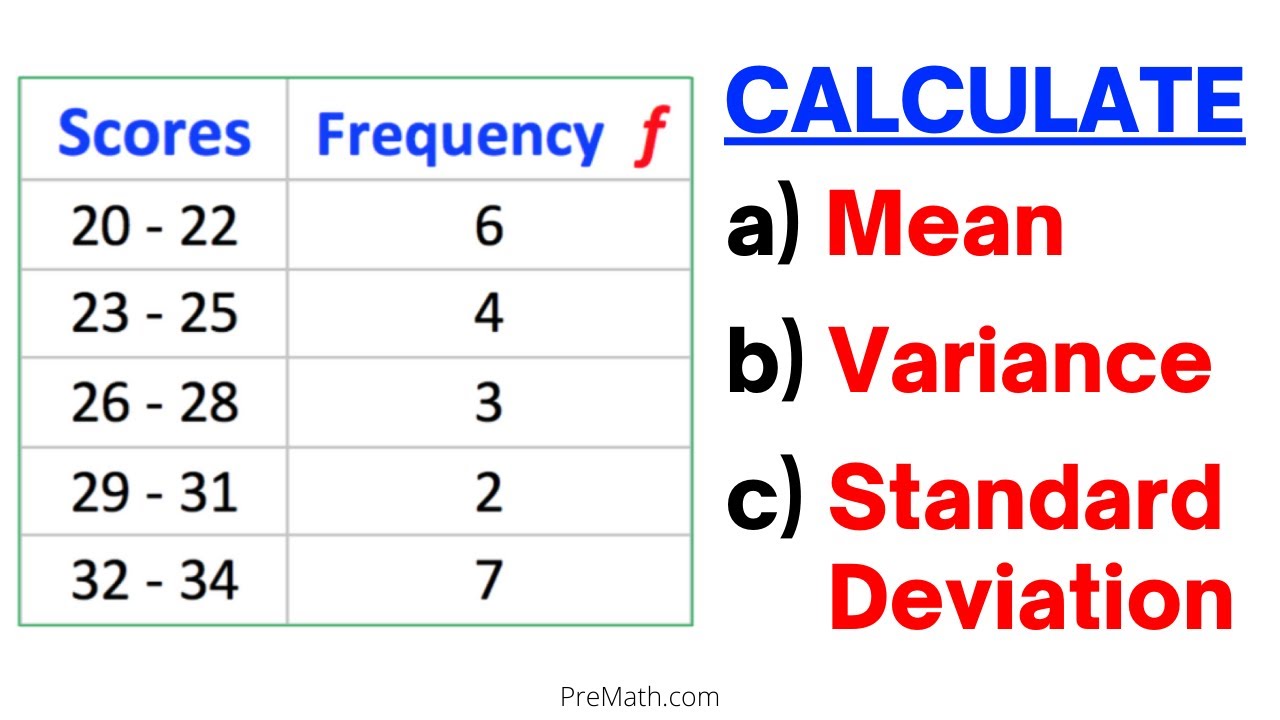
Can You Find Mean, Variance, & Standard Deviation of a Frequency Grouped DataTable? Simple Tutorial
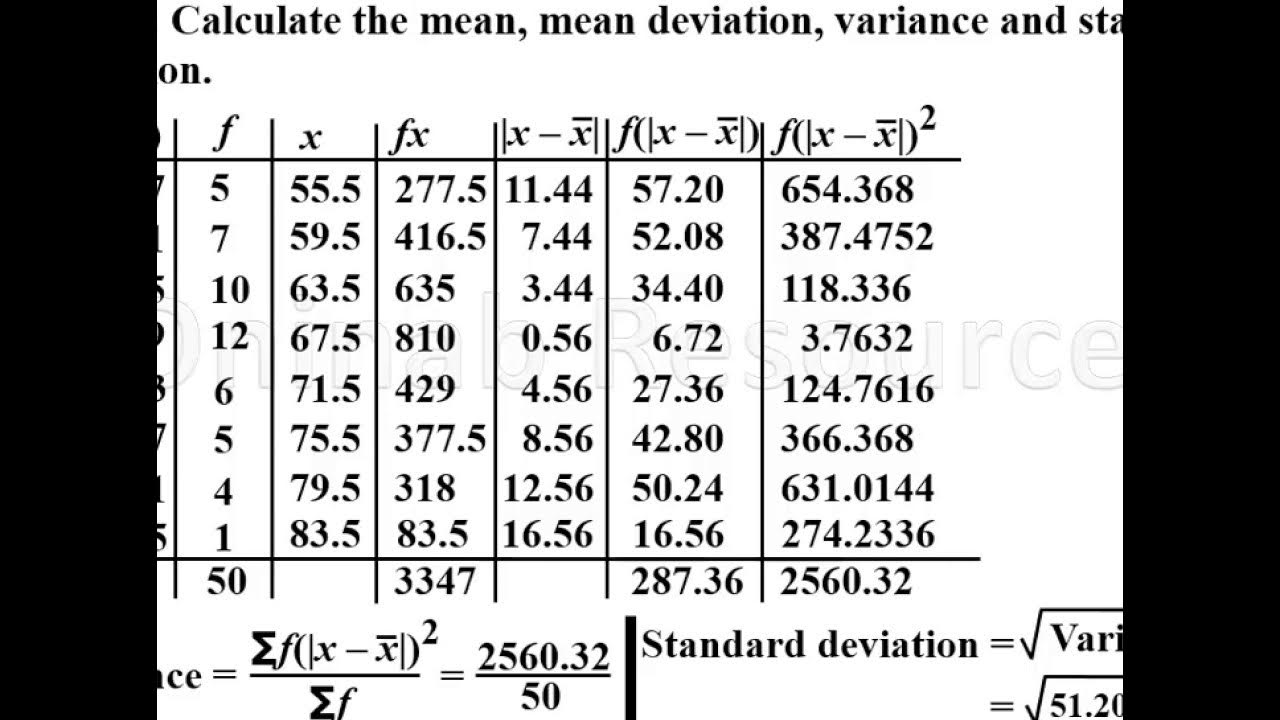
Mean deviation, variance and standard deviation of grouped data.
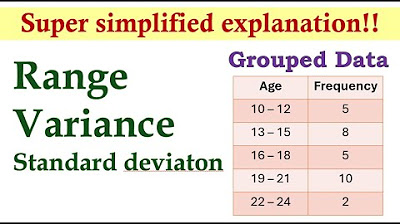
Measures of Dispersion (Grouped Data) | Basic Statistics

What is a "Standard Deviation?" and where does that formula come from
Mean, Median and Mode of Grouped Data(Lesson 2)
5.0 / 5 (0 votes)
Thanks for rating: