Quality (Part 1: Statistical Process Control)
TLDRThis video script delves into the concept of Statistical Process Control (SPC), a vital manufacturing tool for quality assurance. It explains how SPC uses natural process variation, typically represented by the normal distribution or bell curve, to predict and address issues before they escalate. The script introduces the idea of control charts to detect out-of-control conditions, even when products remain within specification limits, and highlights seven common out-of-control patterns. The presentation aims to educate on the origins and applications of SPC in maintaining process stability and product consistency.
Takeaways
- 😀 Statistical Process Control (SPC) is a predictive method used in manufacturing to control quality and address issues before they escalate.
- 📏 In manufacturing, natural variation occurs in the production process, and SPC helps manage this variation within set tolerances to maintain product quality.
- 📊 The concept of natural variation is formalized through the normal distribution or bell curve, where most data points (99.7%) fall within three standard deviations from the mean.
- 🔍 Walter Shewhart, a statistician from the early 20th century, is credited with developing the idea of using statistics to control quality in processes.
- 📈 Control charts are a tool in SPC that track process measurements over time, helping to detect out-of-control conditions that deviate from the expected normal variation.
- 🚫 Out-of-control conditions can be identified by seven specific patterns on control charts, which indicate a need for process adjustment or investigation.
- 🛠 Assignable causes are specific, identifiable events or changes that cause a process to deviate from its normal variation, such as tool wear or machine maintenance issues.
- 📉 Run charts complement control charts by showing the magnitude of variation between parts or groups of parts, which can indicate significant shifts in the process.
- 🔑 Understanding and addressing out-of-control conditions is crucial even if the parts are still within specification, as it prevents potential future quality issues.
- 👨🏫 The script serves as an educational resource on the origins, applications, and benefits of SPC in manufacturing and engineering contexts.
- 🔄 The presenter plans to provide regular updates and videos on manufacturing and engineering topics, engaging with the audience through various social media platforms.
Q & A
What is Statistical Process Control (SPC)?
-Statistical Process Control (SPC) is a method of quality control that uses statistics to monitor and control a process. It allows operators to address issues before they become unmanageable, making it a predictive approach in manufacturing.
Why is it important to control quality in manufacturing?
-Controlling quality in manufacturing is crucial because it ensures that products meet the required specifications and standards. This helps in maintaining the efficiency, reliability, and safety of the products, and ultimately, customer satisfaction.
What is the significance of natural variation in a manufacturing process?
-Natural variation is the inherent randomness in any manufacturing process, which is expected and acceptable within certain limits. Understanding and accounting for this variation helps in maintaining the quality and consistency of the products.
What is the role of a target or nominal dimension in manufacturing?
-The target or nominal dimension is the ideal size or measurement that a manufactured part should have. It serves as the reference point for ensuring that the parts produced are within the acceptable tolerance limits.
Who was the statistician that contributed to the development of SPC?
-The statistician who contributed to the development of SPC is Walter A. Shewhart, who came up with the idea of using statistical methods to control quality in a process during the early 20th century.
What is the significance of the bell curve or normal distribution in SPC?
-The bell curve, or normal distribution, represents the natural variation in a process. It is used in SPC to understand and predict the behavior of the process, with the majority of the data points (99.7%) falling within three standard deviations from the mean.
What are the three standard deviations, or 'three sigma', in the context of SPC?
-In SPC, 'three sigma' refers to the range of plus or minus three standard deviations from the mean of the normal distribution. This range is used to capture 99.7% of the population, ensuring that the process is in control and the product quality is consistent.
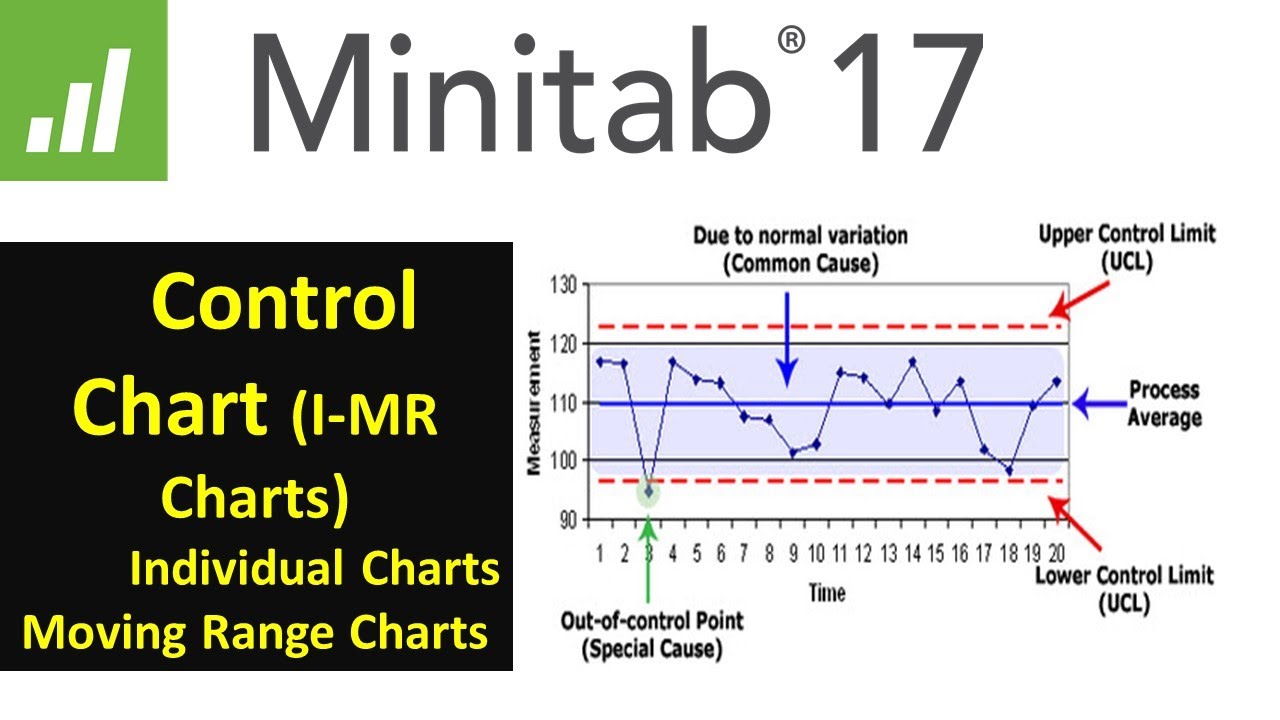
What is a control chart and how does it help in SPC?
-A control chart is a graphical tool used in SPC to track the process data over time. It helps in detecting out-of-control conditions by showing when the process data deviates from the expected normal variation, allowing for timely adjustments.
What are the two types of causes for variation in a process according to the script?
-The two types of causes for variation in a process are common causes, which are the inherent random events with no trends or patterns that account for 99.7% of the variation, and special causes, which are assignable causes or events that can be traced to a specific change or event.
What are the seven out-of-control conditions mentioned in the script?
-The script does not explicitly list the seven out-of-control conditions but refers to them as patterns that indicate a problem with the process. These conditions can include things like a cyclical effect, a total lack of variability, and runs that suggest something unusual is happening, even if the parts are still within specification limits.
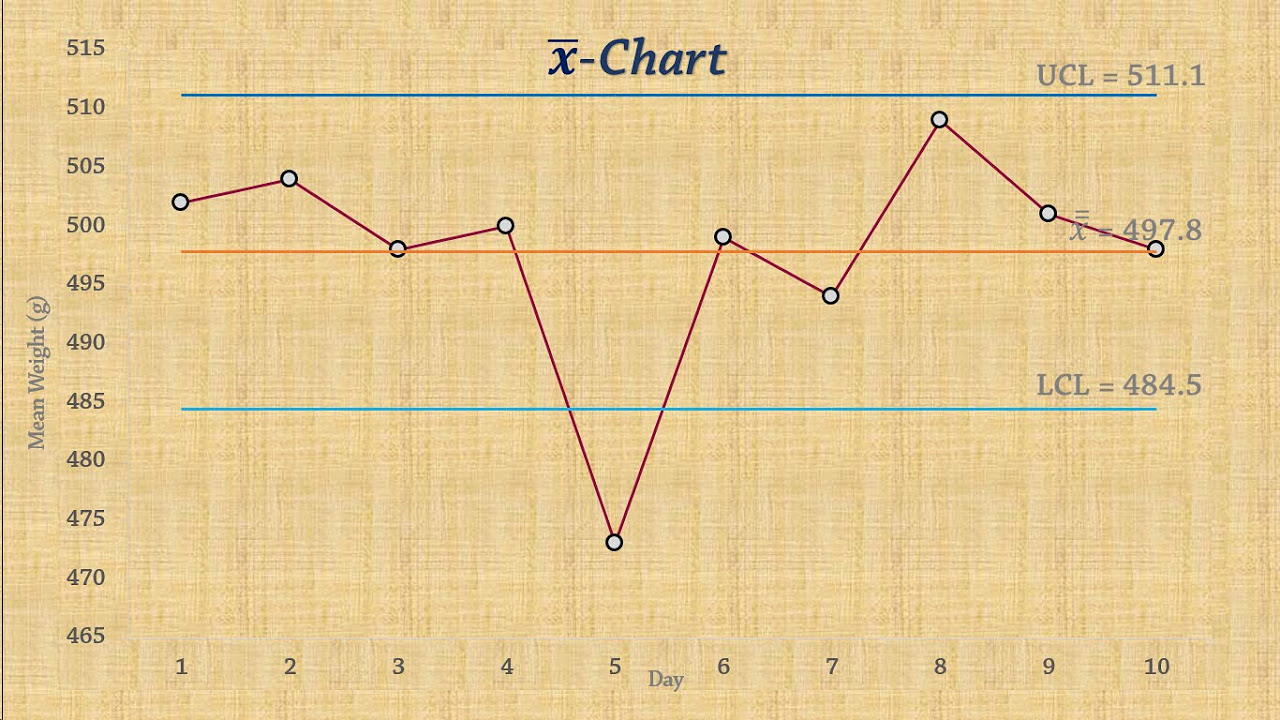
What is the purpose of a run chart in SPC?
-A run chart in SPC supplements the control chart by showing how the parts are varying over time. It is useful for quickly identifying any dramatic shifts or trends in the process that might indicate a need for adjustment or investigation.
Outlines
📊 Introduction to Statistical Process Control (SPC)
The first paragraph introduces the concept of Statistical Process Control (SPC), a method used in manufacturing to ensure quality control through predictive measures. It explains how SPC allows operators to address issues before they escalate, using the example of a part being machined on a lathe. The natural variation in manufacturing processes is discussed, along with the target or nominal dimension and the acceptable tolerances. The historical development of SPC is attributed to a statistician from the early 20th century, who proposed using statistical methods to control process quality. The idea is that by understanding the natural variation in a process, one can detect when the process is deviating into unnatural variations and make necessary adjustments. The normal distribution, or bell curve, which represents the natural variation, is explained, with the significance of three standard deviations (three sigma) being the range within which 99.7% of the population is expected to fall.
📈 Utilizing Control Charts for Quality Detection
The second paragraph delves deeper into the application of control charts, which are used to measure and track parts over time, helping to detect out-of-control conditions. It discusses how even parts within specification limits can indicate process issues if they fall outside control limits. The concept of natural and unnatural variations is further explored, with the introduction of 'special cause' and 'assignable cause' variations. The paragraph explains that while most variations are random and within the normal distribution, any deviation that does not follow this pattern may indicate a specific issue within the process. The seven out-of-control conditions are introduced, which are patterns that suggest something unusual is affecting the process, even if the parts are still within specification limits. The importance of recognizing these patterns for quality control is emphasized.
📉 Understanding Run Charts and Their Role in SPC
The final paragraph discusses the supplementary role of run charts in SPC, which show how parts vary over time and can quickly indicate dramatic shifts or changes in the process. It contrasts run charts with control charts, highlighting the ability of run charts to show significant jumps or changes that might not be immediately apparent in a control chart. The paragraph emphasizes the importance of reacting to these changes to maintain process stability. The video script concludes by summarizing the purpose of control charts and SPC, and the presenter invites viewers to follow their social media channels and subscribe to the channel for more updates on manufacturing and engineering topics.
Mindmap
Keywords
💡Quality Control
💡Statistical Process Control (SPC)
💡Variation
💡Tolerance
💡Normal Distribution
💡Control Chart
💡Out-of-Control Conditions
💡Assignable Causes
💡Special Causes
💡Run Chart
💡Mean
💡Sigma
Highlights
Introduction to Statistical Process Control (SPC) as a predictive method for quality control in manufacturing.
Explanation of natural variation in manufacturing processes and the importance of addressing issues before they escalate.
Historical context: The early 20th-century statistician who pioneered the use of statistics for quality control in processes.
The concept of natural variation forming a bell curve or normal distribution in data points collected over time.
The significance of the three-sigma rule in capturing 99.7% of the population within a normal distribution.
How a histogram and bell curve help understand the natural variation of a manufacturing process.
The development of a control chart to measure and track process data over time.
The benefits of a control chart in detecting out-of-control conditions in a process.
Differentiating between special causes and assignable causes for out-of-control conditions.
The seven out-of-control conditions that indicate a problem with the manufacturing process.
The role of a run chart in supplementing control charts to show major shifts or variations in the process.
How control charts and run charts provide a visual tool for operators to react to process variations.
The importance of understanding out-of-control conditions even when parts are still within specification limits.
The practical application of SPC in identifying and addressing process issues before they impact product quality.
The impact of machine maintenance and tool wear on process variation and control.
The value of statistical process control in ensuring product consistency and quality in manufacturing.
The presenter's plan for regular video updates and engagement on social media platforms.
An invitation for viewers to subscribe to the channel for more manufacturing and engineering topics.
Transcripts
Browse More Related Video
Introduction to Statistical Process Control Charts (Lean Six Sigma)

SPC - The Lean Six Sigma Tool You Must Know (Statistical Process Control)
Statistical Process Control | SPC Control charts (IMR ) using Minitab 17 |

CONTROL CHART BASICS and the X-BAR AND R CHART +++++ EXAMPLE

The 7 Quality Control (QC) Tools Explained with an Example!
Statistical Process Control | Chart for Means (x-bar chart)
5.0 / 5 (0 votes)
Thanks for rating: