Analyzing Sets of Data: Range, Mean, Median, and Mode
TLDRThe video explains different types of averages used in statistics. It provides an example data set of baseball hits across 10 games to demonstrate range, mean, median, and mode. The mean is the sum divided by the number of data points. The median is the middle value. The mode is the value that appears most frequently. Each average has strengths and weaknesses, so selecting the appropriate one depends on the data set and what you aim to communicate. Using averages helps summarize data, but outliers can skew the mean, so median and mode might better represent typical values.
Takeaways
- 😀 The word 'average' implies that something is typical or representative of a larger data set
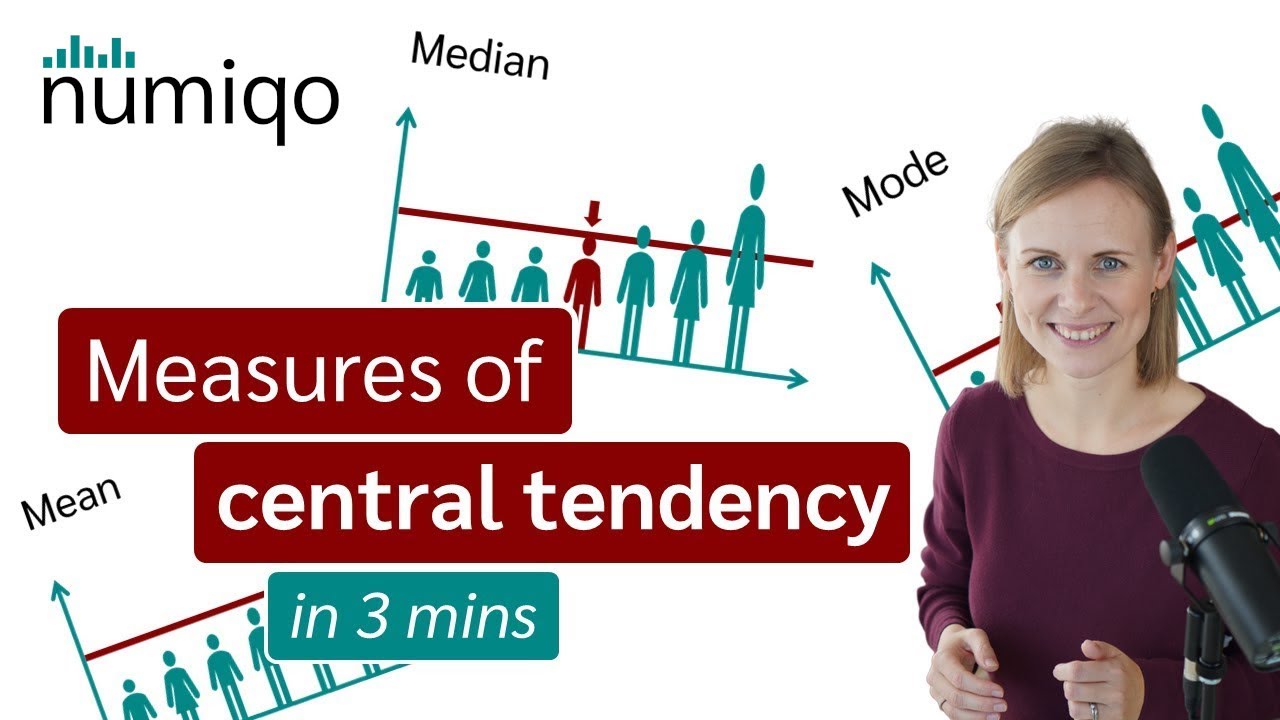
- 😊 There are different ways to calculate averages or central tendencies of data, including the mean, median, mode and range
- 📈 The mean is calculated by adding up all numbers and dividing by the total count
- 📉 The median is the middle number of a data set put in numerical order
- 👍 The mode is the number that appears most frequently in a data set
- 🔢 The range is the difference between the maximum and minimum values
- 📊 These averages can describe different aspects of data and have different applications
- 🤔 The mean can be skewed by outliers, while the median or mode may better represent typical values
- 🏅 For a small odd-numbered data set, the median is the number in the middle
- 🥇 For larger even-numbered sets, the median is the mean of the two central numbers
Q & A
What are the four main types of averages discussed in the video?
-The four main types of averages discussed are range, mean, median, and mode.
How is the range of a data set calculated?
-The range is calculated by taking the difference between the largest and smallest values in the data set.
What is the formula used to calculate the mean?
-The mean is calculated by adding up all the values in the data set and dividing the sum by the total number of values.
How is the median value determined for a data set with an odd number of values?
-For a data set with an odd number of values, the median is the value in the middle of the ordered data set.
What does it mean if the mode occurs multiple times in a data set?
-If a value occurs most frequently in a data set, meaning it has the highest frequency, then it is the mode. If multiple values occur the same number of times, then there can be more than one mode.
When would the median be more useful than the mean?
-The median can be more useful than the mean when there are extreme outliers that skew the data. Using the median reduces the impact of those outlier values.
What information does the range provide about a data set?
-The range shows the full span or scope of the data set - the difference between the maximum and minimum values.
What is indicated when we talk about the average day or average value?
-Describing an average day or average value typically refers to the mean or median as a representation of what is normal or typical.
What terminology is used to describe the number that occurs most frequently in a data set?
-The mode is the term used to describe the number or value that appears most frequently in a data set.
Why are different types of averages useful in statistics?
-Different averages highlight different characteristics of a data set. Using mean, median and mode together provides a more comprehensive statistical picture than relying on just one.
Outlines
😀 Defining and comparing averages
This paragraph introduces the concept of an average and its everyday usage. It states that an average implies a typical or representative value of a larger data set. The paragraph then poses questions about how to compute an average and whether there are different kinds of averages, setting up the main discussion.
😊 Numerical example for averages
This paragraph provides a numerical example of a data set with 10 values representing the number of hits in 10 baseball games. It introduces statistical concepts like the range, mean, median, and mode that can be used to describe the data, giving specific calculations for this data set. The purpose is to illustrate these different averages.
📈 Applications and significance of different averages
This final paragraph contrasts the utility of the mean versus the median or mode for summarizing data sets. It gives an example where the median or mode would be more appropriate than the mean due to the presence of anomalous outlier data. The key point is that different types of averages serve different purposes for summarizing and communicating insights from data.
Mindmap
Keywords
💡average
💡mean
💡median
💡mode
💡range
💡data set
💡frequency
💡anomalous data
💡central tendency
💡statistically significant
Highlights
The word “average” implies that something is typical or representative of a larger data set.
To find the mean, add up all the numbers and divide by the number of items in the set.
The median is the middle value when the data set is ordered.
For sets with an odd number of values, the median is the middle value.
For sets with an even number of values, the median is between the two middle values.
The mode is the value that appears most frequently in the data set.
The range, mean, median and mode summarize data in different ways.
The median can be more useful than the mean if there is anomalous data.
The median and mode may better describe typical values with skewed data sets.
Different averages highlight different aspects of a data set.
The range shows the spread between the minimum and maximum values.
The mean can be impacted by outliers.
The median is useful for skewed distributions.
The mode shows the most frequently occurring value.
Selecting the right average depends on your goals and data set properties.
Transcripts
Browse More Related Video
An Average Video | Mean, Median, Mode, and Range
Mean, Median, and Mode: Measures of Central Tendency: Crash Course Statistics #3
Finding mean, median, and mode | Descriptive statistics | Probability and Statistics | Khan Academy
Math Antics - Mean, Median and Mode
Mean, Median and Mode - Measures of Central Tendency
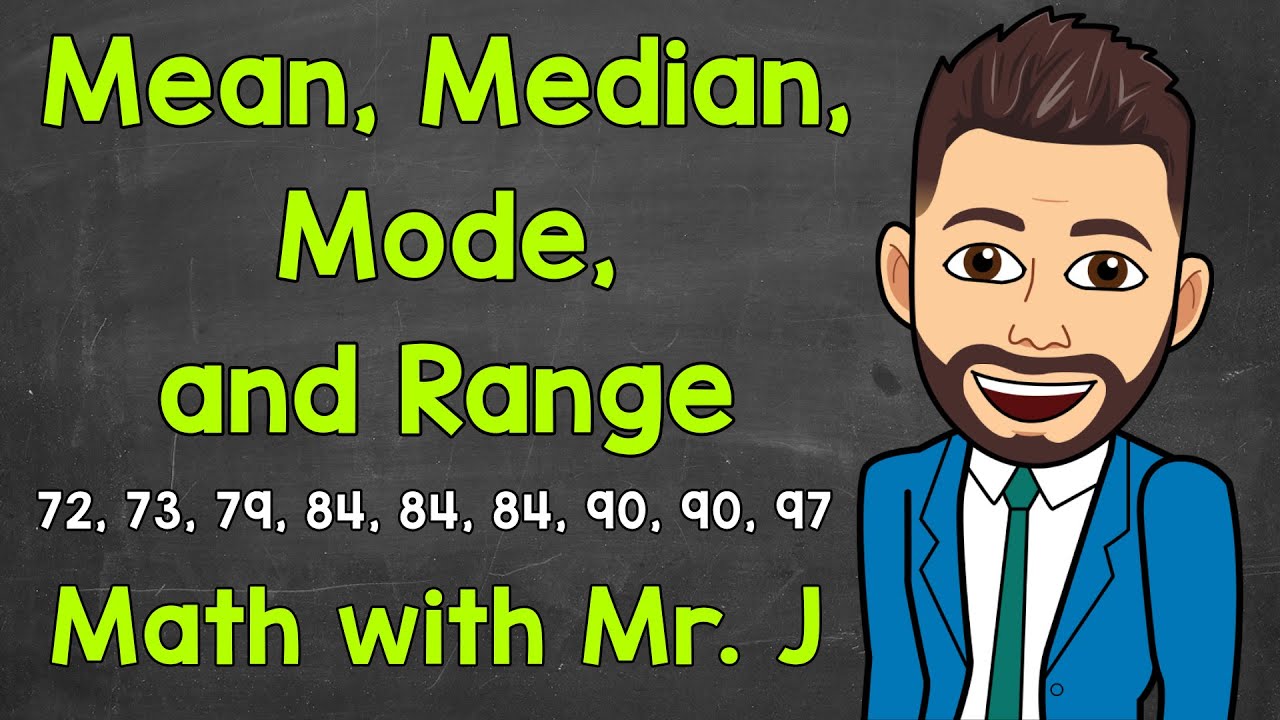
Mean, Median, Mode, and Range | Math with Mr. J
5.0 / 5 (0 votes)
Thanks for rating: