Sketching Derivatives From Parent Functions - f f' f'' Graphs - f(x), Calculus
TLDRThis educational video script guides viewers through the process of graphing derivatives of functions. It explains how to find the first and second derivatives by analyzing the slope and concavity of the parent function. The script uses examples like x squared, negative x squared, and x cubed to illustrate how to sketch f' and f'' graphs. It further discusses identifying increasing/decreasing intervals, critical points, relative extrema, concavity, and inflection points. The importance of recognizing where the slope is zero and the function's differentiability is emphasized, providing a comprehensive understanding of function analysis through derivatives.
Takeaways
- 📈 The derivative of a function, f'(x), represents the slope of the tangent line to the curve of f(x) at any point x.
- 📚 If the parent function is known, such as f(x) = x^2, the derivative f'(x) can be easily calculated, in this case, f'(x) = 2x.
- 📉 The graph of f'(x) can be determined by analyzing the increasing and decreasing nature of f(x), as the slope of f(x) becomes the y-values of f'(x).
- 🔄 The second derivative, f''(x), can be found by differentiating f'(x), and it provides information about the concavity of the function.
- 📊 The sign of f'(x) indicates whether the original function f(x) is increasing (positive) or decreasing (negative).
- 🔍 To sketch f'(x) from a given graph of f(x), identify where the slope is zero, and plot these points as x-intercepts on the f'(x) graph.
- 🌐 For functions that are not differentiable at certain points, such as sharp turns or vertical asymptotes, the derivative f'(x) will have discontinuities.
- 📌 At points where f(x) has a horizontal tangent line, the y-value of f'(x) is zero, indicating a critical point.
- 🔄 Changes in the sign of f'(x) from positive to negative or vice versa indicate relative maxima and minima, respectively.
- 🔄 The concavity of f(x) can be determined by analyzing the intervals where f'(x) is increasing or decreasing, with f''(x) indicating the sign of concavity.
Q & A
What is the derivative of the function f(x) = x^2?
-The derivative of the function f(x) = x^2 is f'(x) = 2x, which is a linear function with a slope of two.
How does the graph of f'(x) relate to the slope of f(x)?
-The graph of f'(x) represents the slope of f(x) at any point x. The y-values of f'(x) are the slopes of f(x).
What is the second derivative of f(x) = x^2?
-The second derivative of f(x) = x^2 is f''(x) = 2, which is a constant horizontal line with a y-value of 2.
How can you determine if a function is increasing or decreasing by its derivative?
-A function is increasing where its first derivative is positive (above the x-axis) and decreasing where its first derivative is negative (below the x-axis).
What does a horizontal tangent line on the graph of f(x) indicate about the slope?
-A horizontal tangent line on the graph of f(x) indicates that the slope of the function is zero at that point, which corresponds to a y-value of zero on the graph of f'(x).
How can you sketch the graph of f''(x) if f(x) is given as a parabola opening downward?
-If f(x) is a downward-opening parabola like -x^2, then f'(x) would be -2x, and f''(x) would be -2, a horizontal line with a y-value of -2.
What is the relationship between the concavity of f(x) and the sign of f''(x)?
-The function f(x) is concave up where its second derivative f''(x) is positive and concave down where f''(x) is negative.
How can you identify the intervals where f(x) is concave up or concave down from its graph?
-To identify concavity, look for the upward 'U' shape (concave up) and downward 'U' shape (concave down) in the graph of f(x). The points where the concavity changes are the inflection points.
What does a jump discontinuity in the graph of f'(x) indicate about the original function f(x)?
-A jump discontinuity in the graph of f'(x) indicates that the original function f(x) is not differentiable at that point, meaning the slope changes instantaneously.
How can you determine the critical points of f(x) if you are given the graph of f'(x)?
-The critical points of f(x) occur where the first derivative f'(x) is equal to zero, which is where the graph of f'(x) touches the x-axis.
What is the derivative of the absolute value function |x|?
-The derivative of the absolute value function |x| is not defined at x = 0, but it consists of two horizontal lines: one with a y-value of -1 for x < 0 and another with a y-value of 1 for x > 0.
How can you sketch the graph of f'(x) if f(x) resembles a sine wave?
-If f(x) resembles a sine wave, then f'(x) would be the cosine function, which starts from the top and oscillates between -1 and 1, crossing the x-axis at points where the slope of the sine wave is zero.
Outlines
📉 Understanding Derivatives through Graphs
This paragraph explains how to derive the first and second derivatives of a function using its graph. It begins with an example of the function f(x) = x^2 and derives f'(x) = 2x and f''(x) = 2. The paragraph also discusses the significance of the slope and how it translates to the y-values of the derivative's graph. It uses various examples to illustrate how to sketch the derivatives and analyze their slopes, focusing on points where the function has a horizontal tangent line (slope zero) and whether the function is increasing or decreasing.
📈 Sketching Derivatives for Different Functions
This paragraph continues the discussion on deriving and sketching the first and second derivatives of functions. It uses the example of f(x) = x^3 to demonstrate how the derivative f'(x) = 3x^2 forms an upward parabola and f''(x) = 6x forms a linear function with a high slope. The analysis includes identifying points where the slope is zero and whether the function is increasing or decreasing. Additionally, the paragraph emphasizes the relationship between the slopes and the y-values of the derivatives.
🔄 Identifying Slope and Discontinuities
This paragraph discusses how to graph the derivative f'(x) when the parent function is unknown. It includes analyzing points where the slope is zero and determining the behavior of the function between these points. The paragraph also covers how to handle discontinuities in the derivative, indicating where the function is not differentiable. The example provided involves identifying regions where the function is increasing or decreasing and sketching the corresponding derivative graph.
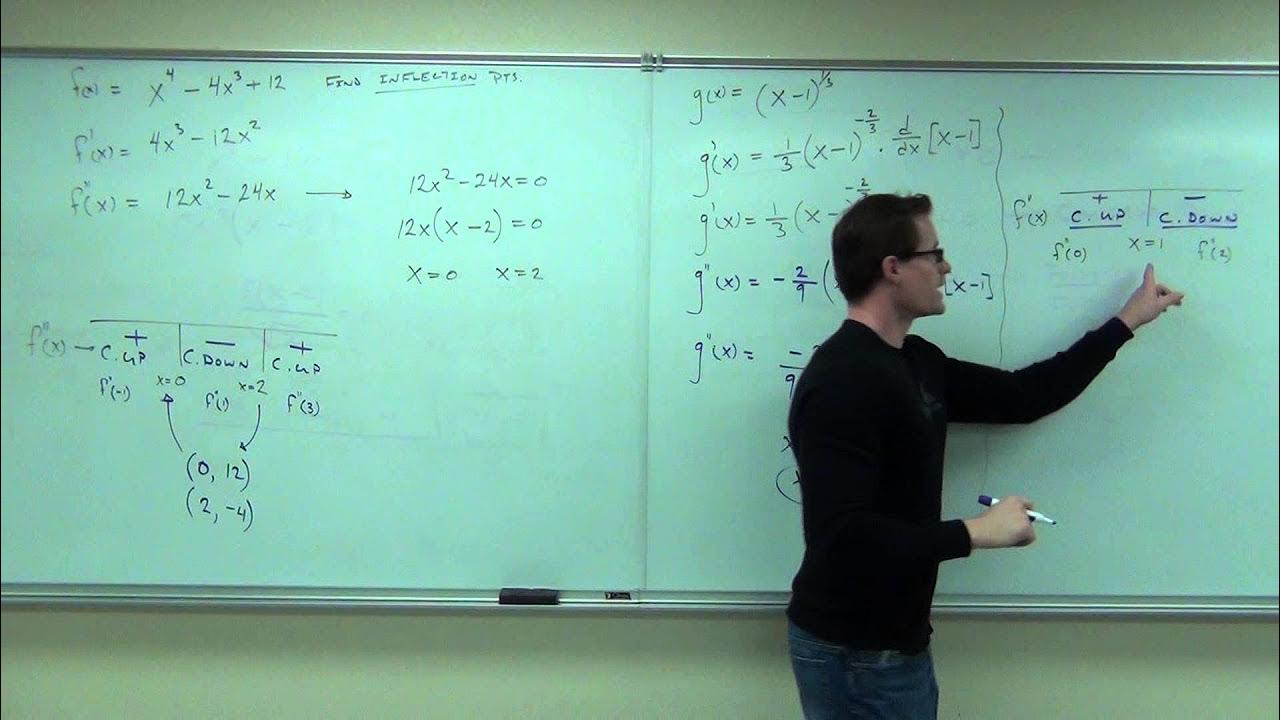
📐 Analyzing Concavity and Inflection Points
The focus of this paragraph is on determining the concavity and inflection points of a function based on its graph. It explains how to identify intervals where the function is concave up or concave down and points where the concavity changes direction (inflection points). The example function used for illustration is a cubic polynomial, and the analysis includes discussing critical points, relative extrema, and intervals of concavity.
🔍 Critical Points and Relative Extrema
This paragraph provides a detailed analysis of identifying critical points, relative maxima, and minima of a function using its graph. It discusses how to find points where the slope is zero and classify these points as maxima or minima based on the changes in the slope's sign. The paragraph also explains the concept of concavity and how to determine when the function is concave up or concave down. The example function is analyzed to identify the intervals of increase and decrease and the locations of relative extrema.
🧩 Understanding Function Behavior via Derivatives
This paragraph explains how to analyze the behavior of a function based on its first derivative graph f'(x). It covers how to identify intervals where the original function f(x) is increasing or decreasing by looking at where f'(x) is positive or negative. The paragraph also discusses how to find critical points and determine the relative maxima and minima using the first derivative graph. Additionally, it touches on the concavity of the function and how the second derivative relates to the concavity.
🔧 Applying Derivative Concepts to Various Functions
The final paragraph summarizes the application of derivative concepts to analyze the behavior of functions. It reiterates how to determine intervals of increase and decrease, identify critical points, and classify relative extrema. The paragraph also reviews how to find intervals of concavity and locate inflection points. The example function used consolidates the understanding of these concepts, providing a comprehensive approach to sketching and analyzing derivative graphs.
Mindmap
Keywords
💡Derivative
💡Slope
💡Tangent Line
💡Increasing Function
💡Decreasing Function
💡Critical Points
💡Relative Extrema
💡Concavity
💡Inflection Points
💡Discontinuity
Highlights
Deriving the graph of f' from f(x) involves understanding the slope of f at any point x.
The derivative of x^2 is 2x, illustrating the concept of a derivative as a linear function with a slope.
Analyzing the slope of f helps in graphing f', as the slope of f at the origin is zero, affecting the y-value of f'.
The y-values of f' are determined by the sign of the slope of f, which can be positive or negative.
The second derivative, f'', can be graphed by taking the derivative of f', as shown with f' being 2x and f'' being a constant 2.
The slope of a function becomes the y-value of its derivative, a key concept in transitioning from f to f'.
For negative x^2, f' is negative 2x, and f'' is a constant negative two, showing the relationship between the parent function and its derivatives.
The slope of f(x) informs the position of f' above or below the x-axis, crucial for graphing the derivative.
A horizontal tangent line on f(x) corresponds to a y-value of zero in f', indicating a change in slope.
For x^3, f' is 3x^2, an upward parabola, and f'' is 6x, demonstrating the process of finding higher-order derivatives.
Identifying where the slope is zero is essential for sketching f', as it helps locate horizontal tangent lines.
The function's increasing or decreasing nature dictates whether f' is above or below the x-axis.
When f' has a horizontal tangent line, f'' will have a y-value of 0, indicating a point of inflection.
If the parent function is not given, one must deduce its behavior from the graph of f' to sketch f'(x).
Discontinuities in f' occur when the slope of f changes instantaneously, causing jumps in the derivative graph.
The absolute value function, though continuous at zero, is not differentiable there, leading to a discontinuity in its derivative.
Graphing the derivative of a sine wave involves understanding the behavior of cosine, the derivative of sine.
Critical points, relative extrema, and inflection points can be identified from the graph of f or f'.
The concavity of a function and its changes can be deduced from the graph of f' or f''.
When given the graph of f', the function's increasing and decreasing intervals can be determined by the position of f' relative to the x-axis.
The graph of f' allows for the identification of maximums and minimums based on the sign change of f'.
Inflection points are located where the concavity of the function changes, which can be inferred from the graph of f'.
Transcripts
Browse More Related Video

What the Second Derivative Tells You about a Graph

3.2 - Using Second Derivatives to Classify Max and Min Values
Calculus 1 Lecture 3.4: The Second Derivative Test for Concavity of Functions

Calculus AB Homework 4.5: Second Derivative Test
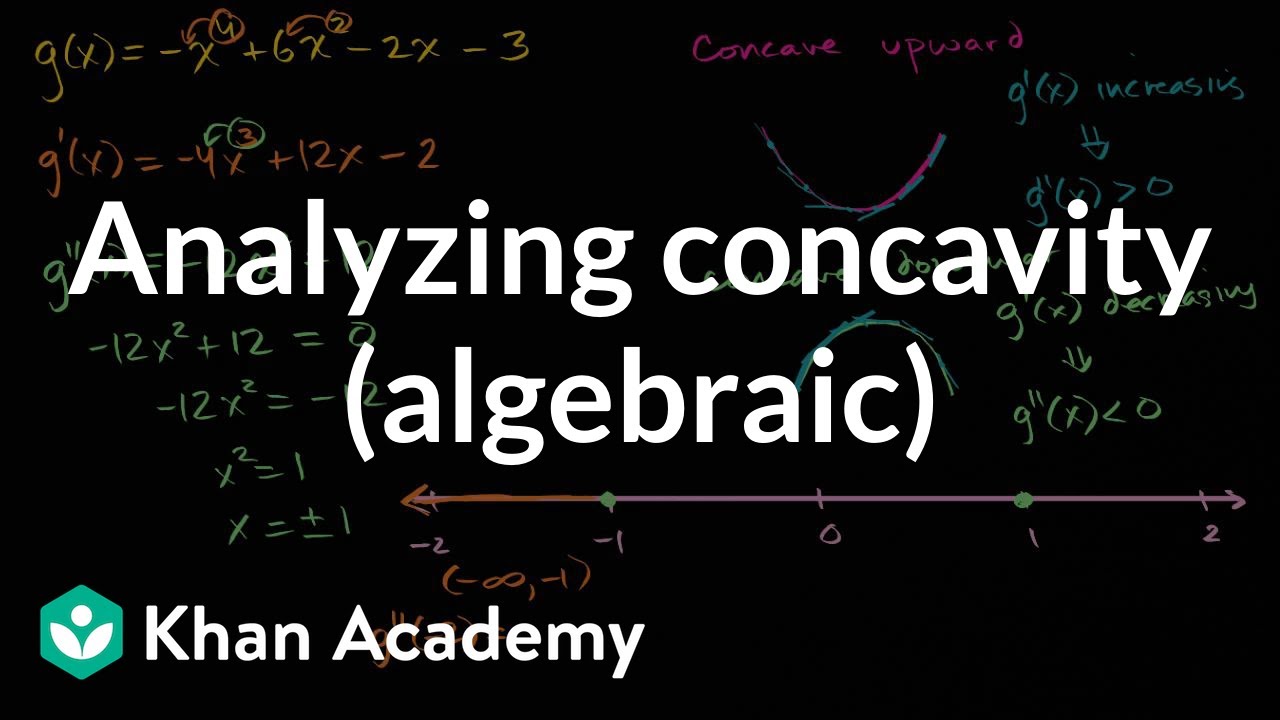
Analyzing concavity (algebraic) | AP Calculus AB | Khan Academy
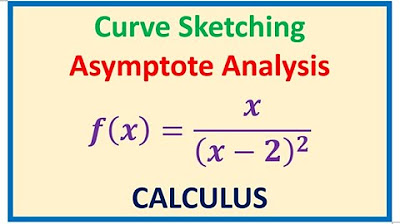
Curve Sketching with Asymptotes x/(x - 2)^2 and Derivatives of Rational Function
5.0 / 5 (0 votes)
Thanks for rating: