3.2 - Using Second Derivatives to Classify Max and Min Values
TLDRThis comprehensive video script delves into the application of derivatives in calculus to analyze the behavior of functions. It begins by explaining how the first derivative can identify increasing and decreasing trends in a function, and critical points that signify transitions in these trends. The focus then shifts to the second derivative, which is instrumental in determining the concavity of a function. A positive second derivative indicates upward concavity (like a cup), while a negative one suggests downward concavity (like a frown). The script elucidates the second derivative test for classifying relative extrema, where a negative second derivative at a critical point signifies a relative maximum, and a positive one indicates a relative minimum. The concept of inflection points, where the concavity changes, is also explored, noting they occur where the second derivative is zero or undefined. The video uses several examples to illustrate these concepts, emphasizing the importance of understanding not only where a function increases or decreases but also how it curves. The script concludes with a discussion on absolute versus relative extrema, setting the stage for further advanced topics in calculus.
Takeaways
- 📌 The first derivative of a function can indicate where the function is increasing or decreasing, which helps in identifying critical points that could represent maximum or minimum values.
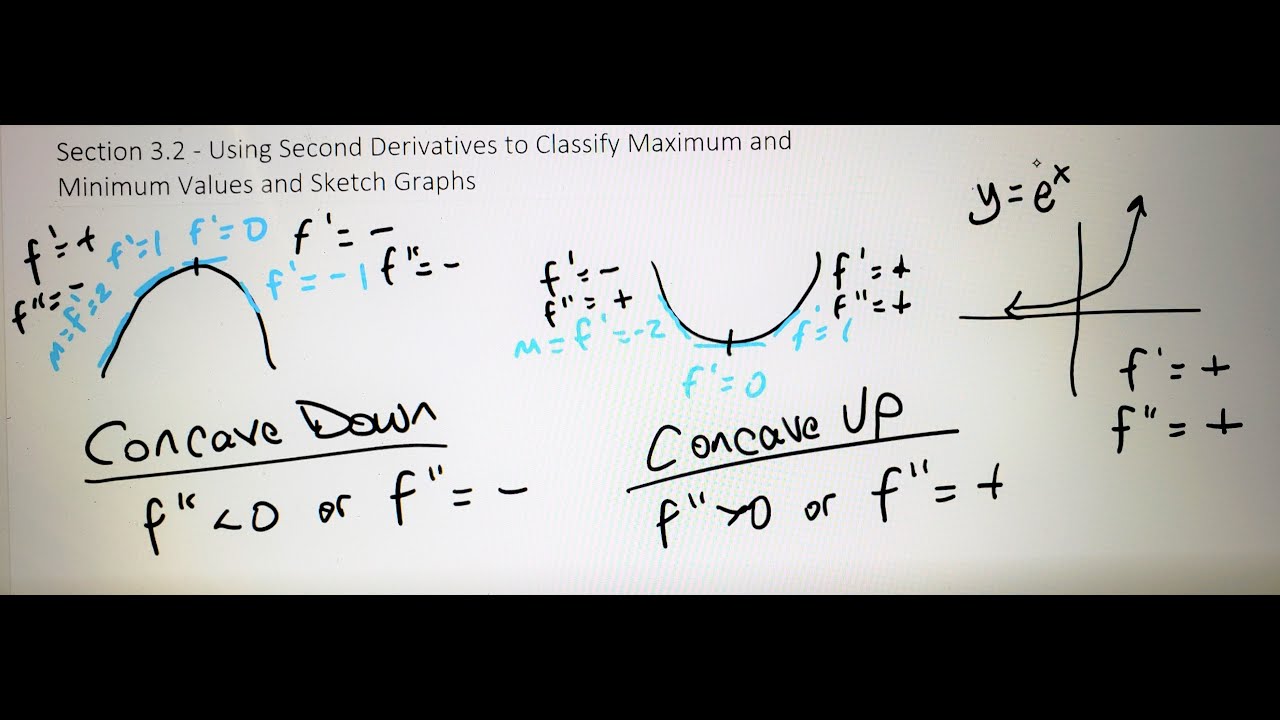
- 📈 The second derivative provides information about the concavity of a function, which is the shape of its bend. A positive second derivative indicates upward concavity (concave up), while a negative second derivative indicates downward concavity (concave down).
- 🔄 Changes in the first derivative correspond to changes in the bending of the graph. If the first derivative goes from negative to positive, there's a bend upward, and if it goes from positive to negative, there's a bend downward.
- ⛰ The second derivative test can classify a critical point as a relative maximum or minimum based on the sign of the second derivative at that point. A negative second derivative at a critical point indicates a relative maximum, while a positive second derivative indicates a relative minimum.
- 🔢 The second derivative is the derivative of the first derivative, which means it represents the rate of change of the rate of change. This can be used to analyze the behavior of the original function more deeply.
- 🚫 It's important to note that concavity and monotonicity (increasing/decreasing) are separate concepts. A function can be concave up and either increasing or decreasing, and the same is true for concave down.
- 🤔 The second derivative test can be inconclusive if the second derivative equals zero at a critical point. In such cases, the first derivative test or the graph of the function may be used to determine the nature of the point.
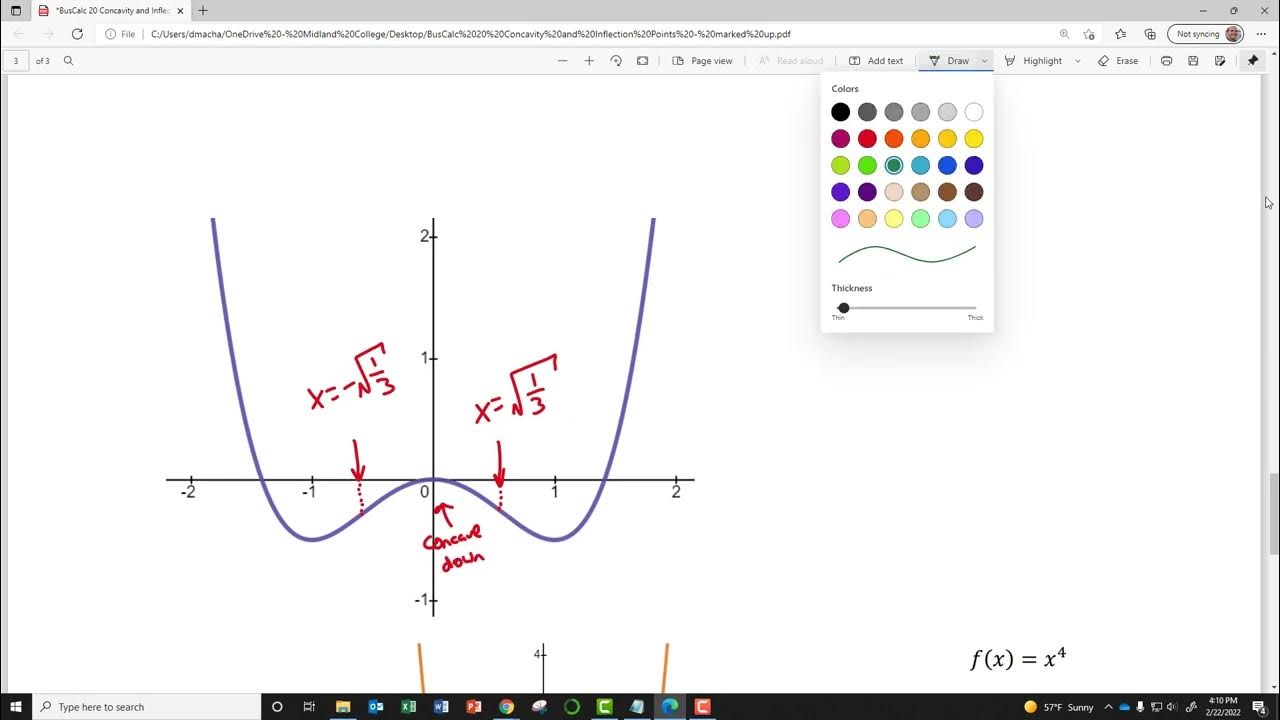
- 🏞 Points of inflection, where the concavity of a graph changes, can be found by determining where the second derivative is zero or undefined. These points break the graph into intervals of different concavity.
- 📐 The sign of the second derivative can be used to determine the shape of the graph's bend (concavity) without necessarily knowing the exact values of the function at those points.
- 🔍 To find the actual coordinates of a point of inflection, substitute the x-value of the point into the original function, which allows for the calculation of the corresponding y-value.
- 📋 The process of analyzing a function using the first and second derivatives involves finding critical values, classifying intervals of increase or decrease, and identifying points of inflection to understand the overall shape and behavior of the graph.
Q & A
What is the primary purpose of using the first derivative to analyze a function?
-The first derivative is used to classify maximum and minimum values of a function. It indicates where a function is increasing or decreasing by its sign, and the points of transition between these behaviors are known as critical values.
How does the second derivative provide information about a function?
-The second derivative, which is the derivative of the first derivative, provides information about the concavity of a function. It tells us how the first derivative is changing, thus giving insights into the shape of the graph's bend.
What is the term used to describe the shape of a graph's bend?
-The term used to describe the shape of a graph's bend is 'concavity'. It indicates whether the graph bends downward or upward.
How can one determine concavity from the second derivative?
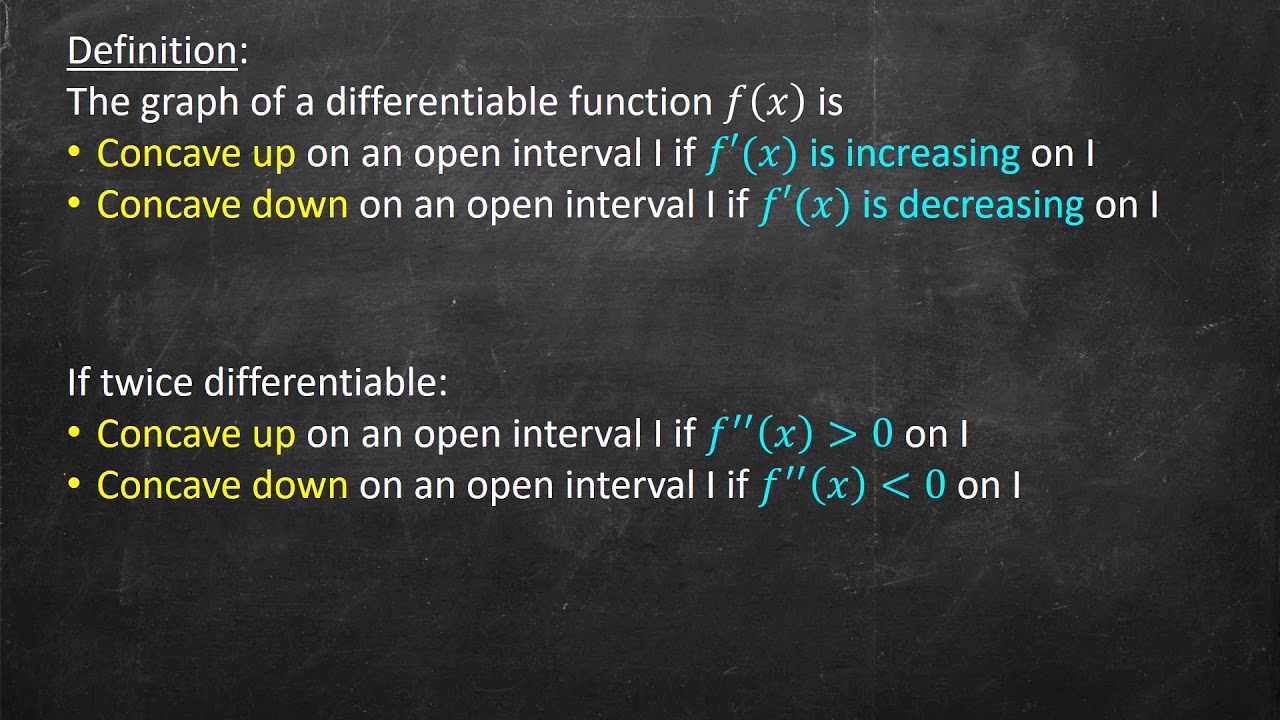
-Concavity can be determined from the second derivative by looking at its sign. If the second derivative is greater than zero, the graph has upward concavity (concave up). If it is less than zero, the graph has downward concavity (concave down).
What is the relationship between the sign of the second derivative and the concavity of a graph?
-A positive second derivative indicates that the first derivative is increasing, which corresponds to upward concavity (concave up). A negative second derivative indicates that the first derivative is decreasing, which corresponds to downward concavity (concave down).
What is the second derivative test, and how is it used to classify extreme values?
-The second derivative test is a method used to classify extreme values of a function by evaluating the second derivative at critical points. If the second derivative is negative at a critical point, the function has a relative maximum at that point. If the second derivative is positive, the function has a relative minimum.
What is an inflection point, and how does it relate to the second derivative?
-An inflection point is a point on the graph of a function where the concavity changes. It occurs where the second derivative is either zero or undefined. The inflection point represents a change from concave up to concave down or vice versa.
How does the second derivative test help in identifying the shape of the graph around a critical point?
-The second derivative test helps by determining the concavity of the graph at a critical point. If the second derivative is positive, the graph shapes like a cup (concave up), indicating a minimum value. If the second derivative is negative, the graph shapes like a frown (concave down), indicating a maximum value.
What is the significance of the second derivative being equal to zero in the context of the second derivative test?
-When the second derivative is equal to zero, the second derivative test is inconclusive for classifying the extreme values. It does not provide enough information to determine whether the point is a maximum, minimum, or neither.
How can one find the points of inflection for a function?
-To find the points of inflection, one must find the values of x where the second derivative is either zero or undefined. These values of x are the potential points of inflection, where the concavity of the graph changes.
What is the difference between a relative maximum or minimum and an absolute maximum or minimum?
-A relative maximum or minimum refers to the highest or lowest point of a function relative to the points around it, within a certain neighborhood. An absolute maximum or minimum, on the other hand, is the highest or lowest point on the entire graph of the function.
Outlines
📈 Understanding First and Second Derivatives
The video begins by discussing the use of the first derivative to classify maximum and minimum values of a function. It explains that the sign of the first derivative indicates whether a function is increasing or decreasing. Critical points are identified as points of transition between these behaviors. The video then introduces the concept of the second derivative, which provides information about the concavity of a function. A positive second derivative indicates that the first derivative is increasing, while a negative second derivative indicates a decreasing first derivative. These concepts are illustrated with graphical examples.
🌌 Concavity and the Shape of Graphs
The second paragraph delves into the concept of concavity, describing it as the shape of the bend in a graph. It explains that a positive second derivative corresponds to upward concavity (concave up), while a negative second derivative corresponds to downward concavity (concave down). The video uses the analogy of a cup for upward concavity and a frown for downward concavity to help remember the concepts. It also clarifies that concavity and monotonicity (increasing or decreasing) are separate concepts and can occur in various combinations.
🔍 Second Derivative Test for Extreme Values
The third paragraph introduces the second derivative test, which is used to classify maximum and minimum values of a function. It explains that if the second derivative is negative at a critical point, the function has a relative maximum at that point, and if the second derivative is positive, there is a relative minimum. The video also discusses how the second derivative test is limited to points where the first derivative is zero, excluding points where the function is not differentiable.
🔢 Applying the Second Derivative Test
The fourth paragraph provides an example of applying the second derivative test to find relative extrema for a specific function. It outlines the process of finding critical values by setting the first derivative to zero and then using the second derivative to classify these values as maxima or minima. The video demonstrates how to evaluate the second derivative at critical points to determine the nature of the extreme values.
📉 Evaluating Extreme Values and Sketching Graphs
In the fifth paragraph, the process of finding the actual extreme values for the function is explained. It involves plugging the critical points into the original function to find the corresponding y-values, which represent the maximum or minimum values. The video also emphasizes the importance of graphing the function to visualize and verify the extreme values and their corresponding points on the graph.
🤔 Second Derivative Test Limitations and Inflection Points
The sixth paragraph discusses the limitations of the second derivative test when the second derivative evaluates to zero, making the test inconclusive. In such cases, the video suggests using the first derivative test or graphing the function to determine the nature of the critical point. It also introduces the concept of inflection points, which are points where the concavity of the graph changes. The video explains how to find inflection points by looking for where the second derivative is zero or undefined.
🔄 Inflection Points and Changes in Concavity
The seventh paragraph focuses on identifying inflection points and classifying the intervals of concavity for a function. It explains that inflection points are locations where the graph changes from concave up to concave down or vice versa. The video demonstrates how to find the x and y coordinates of inflection points and how to determine the intervals over which the function is concave up or concave down.
📌 Locating Inflection Points Algebraically
The eighth paragraph provides a detailed algebraic process for finding inflection points. It involves differentiating the function to find the second derivative and then setting it equal to zero to solve for x. The video shows how to factor and solve the resulting equation to find the x-values of the inflection points. It also discusses how to determine the y-values by substituting these x-values back into the original function.
🔎 Analyzing Concavity with the Second Derivative Graph
The ninth paragraph describes how to use the graph of the second derivative to analyze the concavity of the original function. The video explains that the sign of the second derivative indicates whether the function is concave up or concave down. It demonstrates how to graph the second derivative and use its x-intercepts to determine the intervals of concavity and the locations of inflection points.
🏔️ Relative vs. Absolute Extrema and Concavity
The final paragraph emphasizes the difference between relative and absolute extrema, noting that relative extrema are the highest or lowest points in relation to nearby points, but not necessarily the highest or lowest points on the entire graph. The video also summarizes the information gathered from the first and second derivative tests, which can be used to classify the behavior of the function and its graph, including locations of peaks, valleys, and changes in concavity.
Mindmap
Keywords
💡First Derivative
💡Critical Values
💡Second Derivative
💡Concavity
💡Inflection Points
💡Relative Extrema
💡Second Derivative Test
💡Increasing and Decreasing Intervals
💡Tangent Line
💡Maximum and Minimum Values
💡Graph Sketching
Highlights
The first derivative can classify maximum and minimum values of a function by indicating where the function is increasing or decreasing.
Critical values represent points where the first derivative is either zero or undefined, and they are crucial for identifying relative extreme values.
The second derivative, being the derivative of the first derivative, provides information about the concavity of a function.
A positive second derivative indicates that the first derivative is increasing, suggesting upward concavity (concave up).
A negative second derivative indicates that the first derivative is decreasing, suggesting downward concavity (concave down).
The concept of concavity helps in determining the shape of the bend in a graph, which is essential for sketching the graph accurately.
The second derivative test is used to classify maximum and minimum values by evaluating the concavity at critical points.
If the second derivative at a critical point is negative, the function has a relative maximum at that point due to concave down shape.
If the second derivative at a critical point is positive, the function has a relative minimum at that point due to concave up shape.
The second derivative test is inconclusive if the second derivative at a critical point is zero; further analysis or graphical methods are needed.
The first and second derivative tests can be used independently or in combination to classify the behavior of a function.
Points of inflection, where the concavity changes, can be found by setting the second derivative equal to zero or finding where it is undefined.
The second derivative can also be used to identify intervals of concavity, which further helps in graphing the function.
The function's graph can have different combinations of increasing/decreasing and concave up/concave down, which are independent properties.
The second derivative test confirms the relative extrema by analyzing the curvature of the graph at critical points.
The method of undetermined coefficients is a technique used to solve differential equations and is mentioned in the context of finding the second derivative.
The importance of double-checking calculations and graphing utilities is emphasized to ensure accuracy in finding derivatives and analyzing function behavior.
The use of the second derivative to find inflection points and classify concavity provides a comprehensive understanding of the function's graph.
Transcripts
Browse More Related Video

5.0 / 5 (0 votes)
Thanks for rating: