What the Second Derivative Tells You about a Graph
TLDRThis educational video explores the concept of the second derivative, F''(x), and its implications for the shape of a function's graph. The instructor uses a generic function graph to illustrate how the second derivative indicates changes in slope, marking regions where the slope is increasing or decreasing. The video introduces the terms 'concave up' and 'concave down' to describe the curvature of the graph, resembling a 'happy' or 'sad' face, respectively. It also explains how to identify inflection points, where the concavity changes, and discusses the significance of 'hypercritical values' in determining these points. The presenter concludes with examples to demonstrate finding inflection points and intervals of concavity, emphasizing the importance of correctly calculating derivatives for accurate analysis.
Takeaways
- 📚 The second derivative, denoted as F''(x), provides information about how the slope of a function's graph changes.
- 📈 The first derivative, F'(x), is about slope, and the second derivative is the derivative of the first, indicating changes in slope.
- 📊 Estimating slopes at various points on a graph can help visualize how the slope is changing, and whether it's increasing or decreasing.
- 📉 When the slope is negative and getting less negative (e.g., from -10 to -3), it indicates the slope is increasing.
- 🔼 Conversely, when the slope is positive and getting less positive (e.g., from 2.5 to 1), it indicates the slope is decreasing.
- 😃 The term 'concave up' describes parts of a graph where the slope is increasing, like the upward curve of a smiley face.
- 😞 'Concave down' describes parts of a graph where the slope is decreasing, resembling the downward curve of a sad face.
- 🔍 Inflection points are where a graph changes concavity, from concave up to concave down or vice versa.
- 📝 A function is concave up on an interval if the second derivative is positive, and concave down if the second derivative is negative.
- 📌 Hypercritical values (where the second derivative is zero or undefined) help identify potential inflection points.
- 📋 The sign of the second derivative can be used to create a sign chart, which helps determine where the function is concave up or down.
Q & A
What does the second derivative, F''(x), indicate about a function's graph?
-The second derivative, F''(x), indicates how the slope of the function is changing. It can tell us whether the function's slope is increasing or decreasing.
How is the second derivative related to the first derivative of a function?
-The second derivative is the derivative of the first derivative of a function, essentially describing the rate of change of the slope.
What does a positive second derivative signify about the graph of a function?
-A positive second derivative indicates that the function's graph is concave up, meaning the slope is increasing.
What does a negative second derivative signify about the graph of a function?
-A negative second derivative indicates that the function's graph is concave down, meaning the slope is decreasing.
What is an inflection point in the context of a function's graph?
-An inflection point is a point on the graph where the concavity changes, either from concave up to concave down or vice versa.
What is meant by a function being 'concave up'?
-A function is said to be 'concave up' on an interval if its second derivative is positive, indicating that the slope is increasing throughout that interval.
What is meant by a function being 'concave down'?
-A function is said to be 'concave down' on an interval if its second derivative is negative, indicating that the slope is decreasing throughout that interval.
How can you determine the intervals where a function is concave up or concave down?
-You can determine these intervals by analyzing the sign of the second derivative. If it's positive, the function is concave up; if it's negative, the function is concave down.
What is the significance of hypercritical values in the context of concavity?
-Hypercritical values are the values of x where the second derivative is zero or does not exist. These points help to identify where the function might change concavity, potentially indicating inflection points.
How can you use the second derivative to find inflection points of a function?
-To find inflection points, you set the second derivative equal to zero and solve for x. Then, you test whether the concavity changes at these points by checking the sign of the second derivative on either side of the solution.
Can you identify local extrema using concavity and critical points?
-Yes, if you know a critical point and examine the concavity of the function at that point, you can determine if it's a local minimum or maximum based on whether the second derivative is positive (concave up, local minimum) or negative (concave down, local maximum).
Outlines
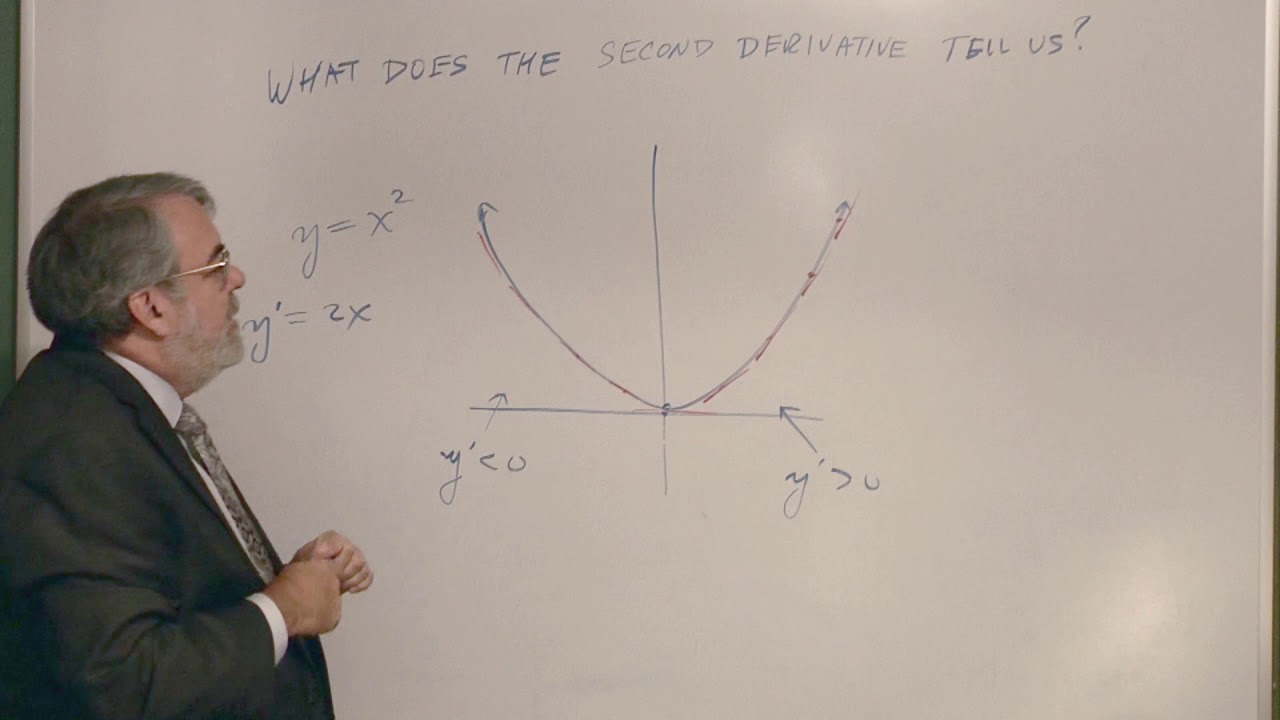
📈 Understanding the Second Derivative and Graph's Concavity
This paragraph introduces the concept of the second derivative, denoted as f''(x), and its role in analyzing a function's graph. The instructor explains that the first derivative represents the slope of a function, while the second derivative indicates how the slope changes. Using a generic function graph as an example, the instructor demonstrates how to estimate the slope of tangent lines at various points. The slopes are categorized as negative, zero (at a local minimum), and positive. The paragraph emphasizes the importance of recognizing where the slope is increasing or decreasing, which corresponds to the graph being 'concave up' (like a smiley face) or 'concave down' (like a sad face). The instructor also clarifies that the terms 'increasing' and 'decreasing' should be used carefully in this context, specifically referring to the slope rather than the function itself.
📉 Graph's Concavity and Inflection Points
The second paragraph delves deeper into the concepts of concavity and inflection points. It explains that a function is concave up on an interval if its second derivative is positive, which is visually represented by the graph curving upwards like a 'happy face'. Conversely, if the second derivative is negative, the function is concave down, curving downwards like a 'sad face'. The paragraph also discusses the mathematical terminology associated with these concepts, such as 'inflection point', which is where the function changes concavity. The instructor mentions 'hypercritical values', which are values of x where the second derivative is zero or does not exist, and these help in identifying regions of concavity. The paragraph concludes with theorems that connect the second derivative's sign to the function's concavity and the identification of inflection points.
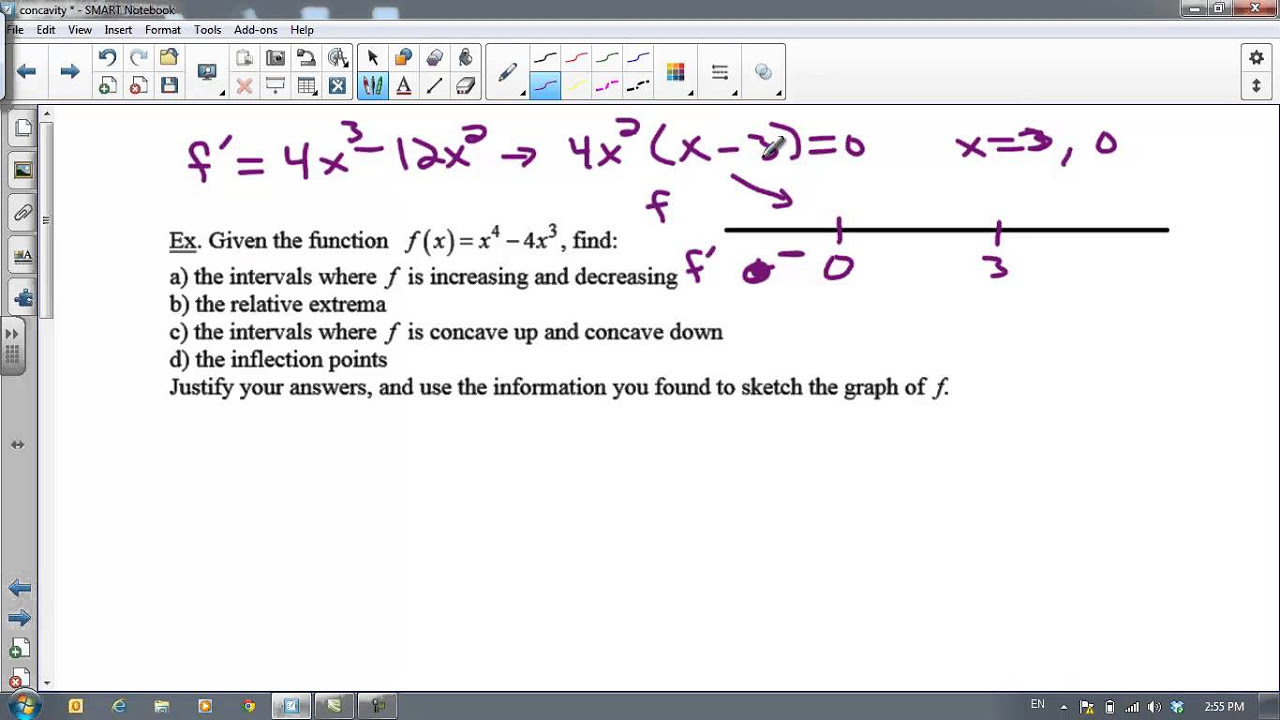
📚 Applying Second Derivative Concepts to Find Inflection Points
In this paragraph, the application of second derivative concepts is demonstrated through an example problem. The focus is on finding inflection points and determining intervals where the function is concave up or down. The process involves calculating the first and second derivatives of a given function, identifying hypercritical values where the second derivative is zero or undefined, and analyzing the sign of the second derivative to establish concavity. The example provided finds that x equals 2 is a hypercritical value, and by testing the concavity on either side of this point, it is concluded that there is an inflection point at x equals 2. The function is concave up for intervals greater than 2 and concave down for intervals less than 2. The paragraph also mentions the importance of graphing the function to visually confirm the concavity and inflection points.
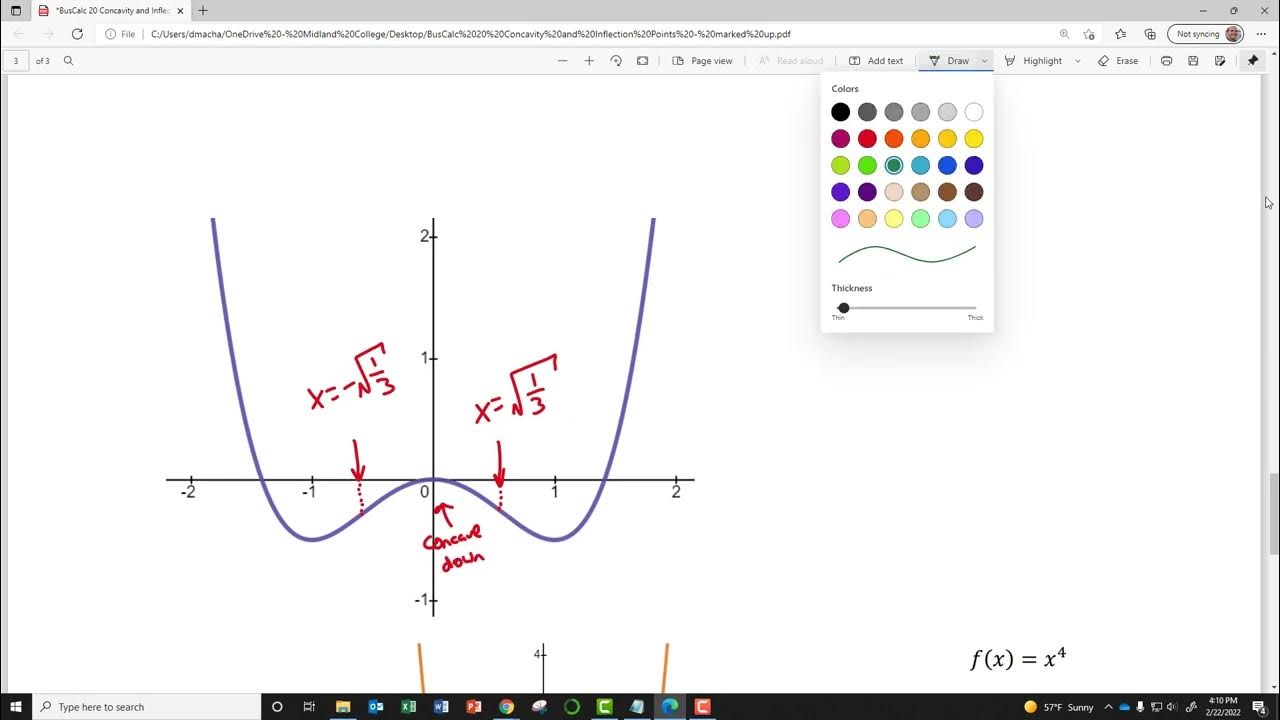
🔍 Visual Confirmation of Concavity and Inflection Points
The final paragraph emphasizes the importance of visually confirming the concavity and inflection points on a graph. It suggests using a graphing calculator to plot the original function and observe the graph's shape around the identified inflection point at x equals 2. The expectation is that the graph should appear cupped upward to the right of x equals 2 and cupped downward to the left, aligning with the earlier analysis based on the second derivative. This visual confirmation is a crucial step in understanding and verifying the mathematical concepts discussed in the previous paragraphs.
Mindmap
Keywords
💡Second Derivative
💡Slope
💡Tangent Line
💡Concave Up
💡Concave Down
💡Inflection Point
💡Critical Value
💡Derivative
💡Sign Chart
💡Local Extrema
Highlights
Introduction to the concept of the second derivative, F''(x), and its relation to the slope of a function's graph.
The first derivative represents the slope of a function, while the second derivative represents how the slope changes.
Graphical estimation of slopes at different points on a function's graph to understand the concept of increasing and decreasing slopes.
Explanation of concavity and its relation to the second derivative, with the graph bending upward (concave up) or downward (concave down).
Use of the terms 'concave up' and 'concave down' to describe the increasing and decreasing slopes, respectively.
Identification of inflection points where the function changes concavity, from concave up to concave down or vice versa.
The mathematical meaning of concavity in terms of the second derivative being positive (concave up) or negative (concave down).
The role of hypercritical values in determining points of inflection and changes in concavity.
The process of finding the first and second derivatives to locate inflection points and intervals of concavity.
The importance of correctly finding derivatives for accurate analysis of concavity and inflection points.
The use of sign charts for the second derivative to determine intervals of concavity and locate inflection points.
The theorem that relates the sign of the second derivative to the concavity of a function on an interval.
The concept of critical points and hypercritical values in the context of concavity and inflection points.
An example problem demonstrating the process of finding inflection points and intervals of concavity using the second derivative.
The method of testing whether a function changes concavity at a hypercritical value to confirm an inflection point.
The practical application of understanding concavity and inflection points in analyzing the behavior of a function's graph.
The conclusion summarizing the importance of the second derivative in determining concavity and locating inflection points.
Transcripts
Browse More Related Video

5.0 / 5 (0 votes)
Thanks for rating: