Descriptive Statistics: The Mean
TLDRIn this introductory video on descriptive statistics, Justin Seltzer explains the concept of the mean, its origin, and how to calculate it from both a population and a sample. He demonstrates the process with a sample dataset and introduces the idea of a weighted mean, showing how it differs from a regular mean. Seltzer also explores the unique scenario of calculating the mean of a categorical variable with binary outcomes, revealing that it represents the proportion of one category. The video concludes with a challenge for viewers to calculate a weighted average mark, encouraging engagement and further learning.
Takeaways
- 📊 The series will cover every descriptive measure needed in statistics, starting with the mean.
- 🧑🏫 The instructor, Justin Seltzer, aims to make concepts intuitive and go beyond boring definitions.
- 🔤 The mean, originating from the French word 'mail,' was initially used in music.
- 🔢 To calculate the mean, sum all observations and divide by the total number of observations.
- 👥 The symbol for the population mean is the Greek letter mu (μ), while for a sample mean, it's a lowercase n.
- 📈 An example calculation of the mean for the sample {10, 28, 28, 33, 54} results in a mean of 30.6.
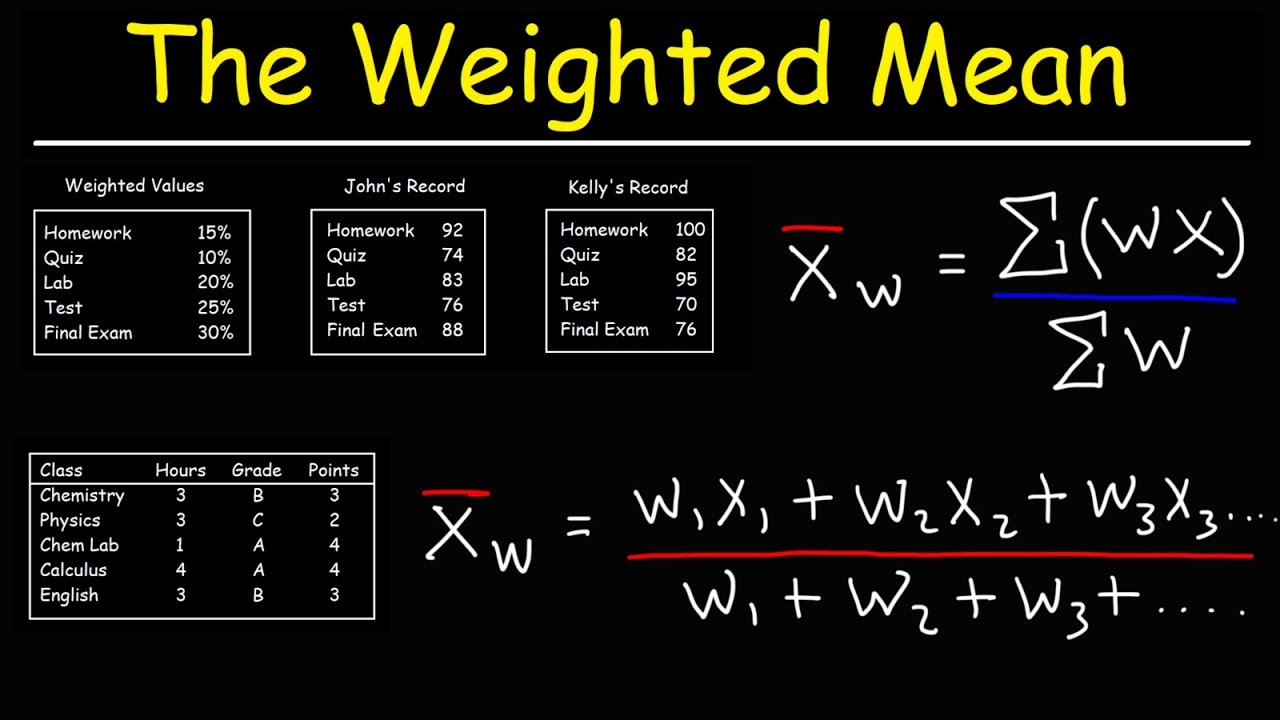
- 📉 The weighted mean considers the frequency of each value and is calculated by summing the weighted values and dividing by the sum of frequencies.
- 📃 A categorical variable's mean, like male (0) and female (1) in a litter of dogs, represents the proportion of one category.
- 🎯 A binary variable's mean gives the proportion of the defined category, such as 0.666... representing the proportion of females.
- 🧩 Challenge: Calculate Georgia's weighted average mark using her grades and the credit points of her subjects.
Q & A
What is the primary focus of the video series?
-The primary focus of the video series is on descriptive statistics.
Who is the instructor for this video series?
-The instructor for the video series is Justin Seltzer.
What specific statistical measure is the first video focused on?
-The first video is focused on the mean.
How is the mean calculated from a population?
-The mean is calculated by summing all the observations (indicated by the Greek letter Sigma) and dividing by the total number of observations, represented by the Greek symbol mu for the population.
How does the calculation of the mean differ between a population and a sample?
-When calculating the mean from a sample, the formula remains the same except that a lowercase 'n' is used to represent the number of observations instead of an uppercase 'N'.
What example is used to demonstrate the calculation of the mean?
-The example used is a sample with values 10, 28, 28, 33, and 54, which are summed and divided by 5 to find the mean.
What is the convention for providing the mean relative to the original data set?
-The convention is to provide the mean to one more decimal place than the original data set. For example, if the original data set has no decimal places, the mean is provided to one decimal place.
What is a weighted mean and how is it calculated?
-A weighted mean is calculated by multiplying each value of the variable X by its frequency, summing these products, and then dividing by the total number of frequencies. This method accounts for the frequency of each value.
Can a mean be calculated for categorical data? If so, how?
-Yes, a mean can be calculated for categorical data if it is binary. By assigning numerical values (e.g., 1 for females and 0 for males), the mean of this numerical data represents the proportion of one category.
What challenge question is posed at the end of the video?
-The challenge question asks viewers to calculate Georgia's weighted average mark from her statistics degree using provided marks and the credit points each subject is worth.
Outlines
📊 Introduction to Descriptive Statistics and Mean
This introductory video by Justin Seltzer is the first in a series on descriptive statistics. It aims to guide viewers through various measures of central tendency, starting with the mean. The mean, derived from the French word 'miel', originally referred to the middle note in music. In statistics, the mean (μ for a population, x̄ for a sample) is calculated by summing all observations and dividing by the total count. The video demonstrates calculating the mean of a sample set of numbers and emphasizes the convention of reporting the mean to one more decimal place than the original data. The presenter also promises to cover advanced topics such as weighted mean, mean of categorical variables, and a challenge question for viewers.
🔢 Understanding Weighted Mean and Categorical Data Mean
The second paragraph delves into the concept of the weighted mean, which takes into account the frequency of each observation in the dataset. It illustrates this by recalculating the mean of a sample, highlighting that the regular mean is a special case of the weighted mean where all weights are equal to one. The video then explores the unique scenario of calculating the mean of a categorical variable with two categories, such as male or female, by assigning numerical values (0 for males, 1 for females) and finding the mean, which in this case represents the proportion of the category defined as 1. Lastly, the presenter poses a challenge to calculate Georgia's weighted average mark from her statistics degree, incorporating her grades and the credit points of each subject, and encourages viewers to share their answers in the comments.
Mindmap
Keywords
💡Descriptive Statistics
💡Mean
💡Population vs. Sample
💡Greek Letter Sigma (Σ)
💡Weighted Mean
💡Categorical Variable
💡Frequency
💡Decimal Places
💡Challenge Question
💡Zed Statistics
Highlights
Introduction to a series on descriptive statistics by Justin Seltzer.
Focus on the mean in the first video of the series.
The mean's etymology from the French word 'mail', meaning the middle of two musical notes.
Symbol mu (μ) represents the mean of a population.
Calculating the mean involves summing all observations and dividing by the total number (n).
For a sample, the mean is represented with a lowercase 'n'.
Explanation of the mean calculation with an example dataset.
Mean result is typically given to one more decimal place than the original data.
Introduction to the concept of a weighted mean.
Demonstration of calculating a weighted mean with an example dataset.
A regular mean is a special case of a weighted mean where all weights are one.
Exploring the mean of a categorical variable with a binary option.
Mean of a binary variable represents the proportion of the category defined as 1.
Challenge question to calculate Georgia's weighted average mark.
Invitation to engage with the rest of the video series on Zed Statistics.
Additional videos on geometric and harmonic means are recommended.
Transcripts
Browse More Related Video
Arithmetic Mean | Geometric Mean | Harmonic Mean
Standard Error (of the sample mean) | Sampling | Confidence Intervals | Proportions
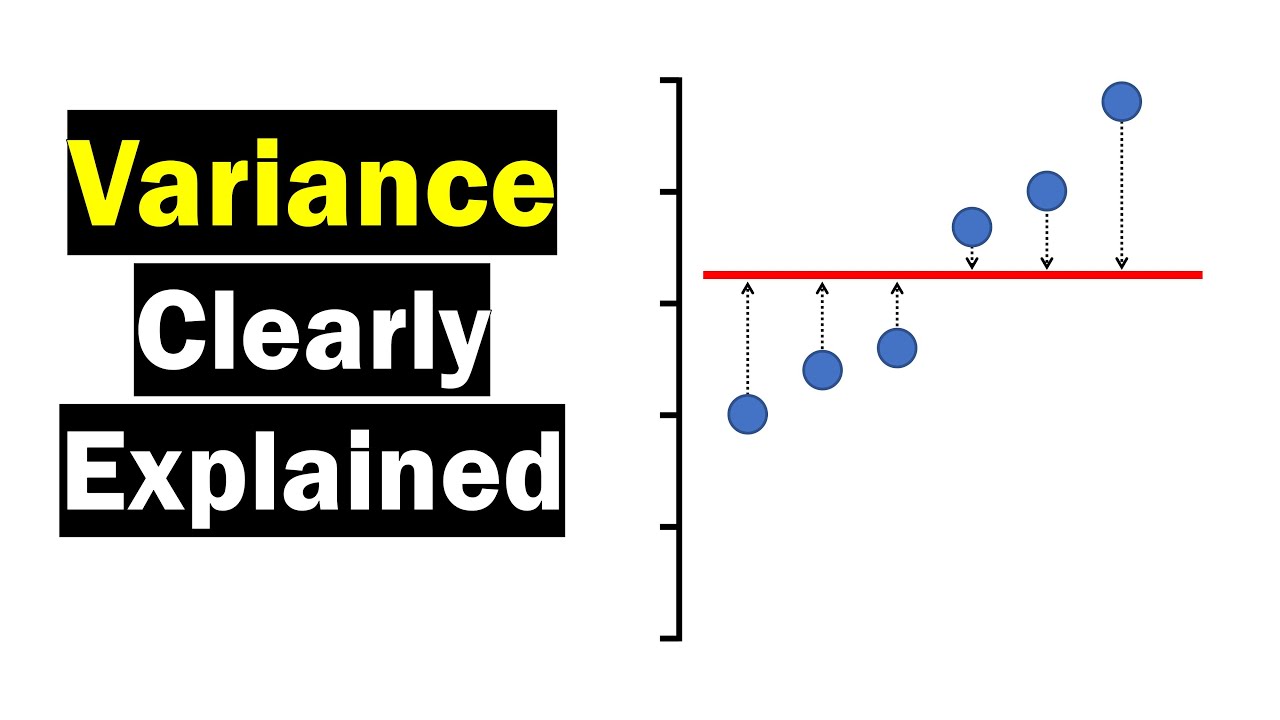
Variance - Clearly Explained (How To Calculate Variance)
Descriptive Statistics: The median
How To Find The Weighted Mean and Weighted Average In Statistics

Standard Error of the Mean
5.0 / 5 (0 votes)
Thanks for rating: