Vertical Line Test
TLDRThis educational video script delves into the concept of functions in mathematics, specifically focusing on the vertical line test as a method to determine whether a given graph represents a function. By examining various equations, such as linear functions, parabolas, circles, and trigonometric functions, the script explains how a graph passes the test if a vertical line intersects it at only one point. It highlights the importance of this test in discerning true functions from non-functions, thereby aiding in the understanding of mathematical relationships and graphical representations.
Takeaways
- 📈 The vertical line test is a method to determine if a graph represents a function.
- 🤔 A graph passes the vertical line test if a vertical line intersects it at only one point.
- 📊 The linear function y = x is an example of a function, as it forms a straight line and passes the test.
- 🔢 The equation x = y^2 does not represent a function because a vertical line intersects it at more than one point.
- 🍃 A parabola y = x^2 passes the vertical line test and is thus a function, as each vertical line intersects the curve at a single point.
- ⭕ A circle's equation (x^2 + y^2 = constant) does not represent a function, as it intersects a vertical line at two points.
- 📶 The horizontal line y = 3 represents a function, as it passes the vertical line test by intersecting at only one point.
- 🔡 A vertical line x = 4 fails the vertical line test, as it intersects any vertical line at an infinite number of points, not representing a function.
- √ The square root function and the absolute value function both pass the vertical line test and represent functions due to their unique shapes.
- 🚫 The graph of √x (square root of x) passes the test, while the sine function x (as depicted in the example) does not pass the vertical line test at certain points.
- 🔢 Functions like x^3 (cubed) and the cube root of x are functions and pass the vertical line test, as indicated by their respective graphs.
Q & A
What is the vertical line test used for in the context of functions and graphs?
-The vertical line test is used to determine whether a graph represents a function. If a vertical line can be drawn that intersects the graph more than once, then the graph does not represent a function. This is because a function, by definition, must have a single output for each input value.
How does the vertical line test apply to a linear function like y equals x?
-For a linear function such as y equals x, if you draw a vertical line, it will intersect the graph at only one point, indicating that the graph represents a function. This is because linear functions are one-to-one, meaning each x-value corresponds to a unique y-value.
What happens when you apply the vertical line test to the equation x equals y squared?
-When applying the vertical line test to the equation x equals y squared, you will find that a vertical line intersects the graph at more than one point. This indicates that the graph does not represent a function, as a function requires that each input value have a unique output value.
How can you tell if a parabola like y equals x squared is a function based on the vertical line test?
-A parabola like y equals x squared will pass the vertical line test because a vertical line will intersect the parabola at only one point. This shows that for each x-value, there is a single corresponding y-value, which is the definition of a function.
What is the result of applying the vertical line test to the equation x squared plus y squared equals nine, which represents a circle?
-The equation x squared plus y squared equals nine represents a circle, and when you apply the vertical line test, the vertical line will intersect the circle at two points. This means the graph is not a function because a function requires that each input value result in a unique output value.
How does the vertical line test work for a horizontal line like y equals three?
-A horizontal line like y equals three will pass the vertical line test because any vertical line drawn on it will intersect at only one point. This is consistent with the definition of a function, as each x-value on the line corresponds to a single y-value.
What happens when you apply the vertical line test to a vertical line like x equals four?
-Applying the vertical line test to a vertical line like x equals four results in failure because a vertical line will intersect it at an infinite number of points. This does not satisfy the criteria for a function, which requires a single output for each input value.
How can you determine if the square root of x and the absolute value of x are functions using the vertical line test?
-Both the square root of x and the absolute value of x can be determined to be functions using the vertical line test because a vertical line will intersect each of these graphs at only one point. This adherence to the one-output-per-input rule confirms that they are indeed functions.
Why does the graph of the sine function of x not pass the vertical line test in the given examples?
-The graph of the sine function of x does not pass the vertical line test in the given examples because it intersects the vertical line at more than one point for a particular line. This indicates that there are multiple output values for at least one input value, violating the definition of a function.
How can you confirm that x cubed and the cube root of x are functions using the vertical line test?
-Both x cubed and the cube root of x can be confirmed as functions using the vertical line test because any vertical line drawn on these graphs will intersect at only one point. This one-to-one correspondence between input and output values is consistent with the definition of a function.
What is the conclusion from the video regarding using the vertical line test to identify if a graph represents a function?
-The conclusion from the video is that the vertical line test is a method to determine if a graph represents a function. If a vertical line intersects the graph more than once, the graph does not represent a function. However, if it intersects at only one point for all vertical lines, then the graph represents a function.
Outlines
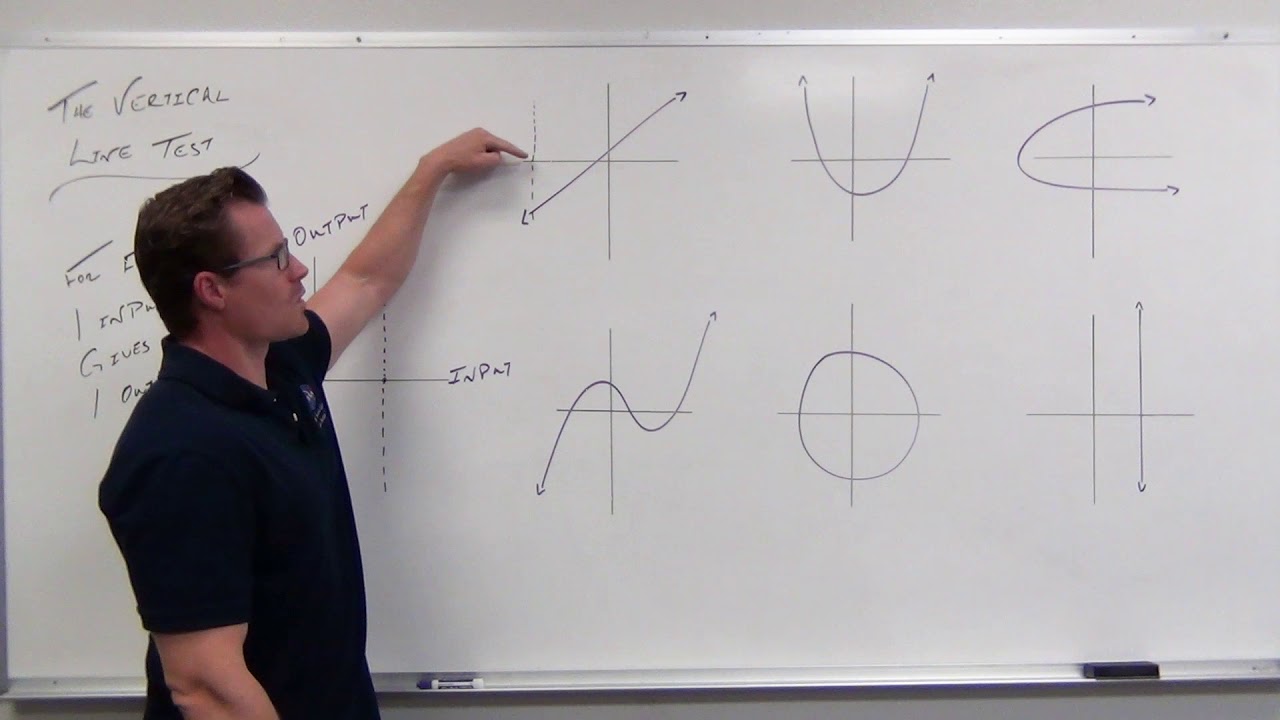
📊 Understanding Functions with the Vertical Line Test
This paragraph introduces the concept of using the vertical line test to determine if a graph represents a function. It explains that a graph passes the test if a vertical line drawn anywhere on the graph touches the graph at only one point. The explanation begins with a linear function (y=x) as an example of a function because it's a straight line that touches a vertical line at a single point. It contrasts this with the equation x=y^2, which is not a function since a vertical line would touch it at more than one point. The paragraph further illustrates the concept with examples of a parabola (y=x^2), a circle (x^2 + y^2 = 9), and a horizontal line (y=3). It also discusses the implications of a vertical line (x=4) and the functions of square root of x and absolute value of x. The paragraph concludes by mentioning the sine function and the functions x^3 and x^(1/3), emphasizing that the latter two pass the vertical line test, while the former does not for a specific graph shown.
📈 Applying the Vertical Line Test to More Graphs
This paragraph continues the discussion on the vertical line test and its application to various graphs. It challenges the viewer to apply the test to the graphs of the square root of x and the absolute value of x, both of which pass the test as they only touch a vertical line at one point. The paragraph then presents two additional examples for the viewer to consider: the sine function (sin(x)) and the functions x^3 and x^(1/3). It clarifies that while the sine function is generally a function, the specific graph shown does not pass the vertical line test, whereas x^3 and x^(1/3) do pass the test. The paragraph concludes by reinforcing the method of the vertical line test as a way to ascertain whether a given graph represents a function.
Mindmap
Keywords
💡Function
💡Vertical Line Test
💡Linear Function
💡Parabola
💡Circle
💡Square Root
💡Absolute Value
💡Sine Function
💡Cube Function
💡Cube Root
💡Graph
Highlights
The video discusses the method of using the vertical line test to determine if a graph represents a function.
A linear function, y equals x, is represented by a straight line and passes the vertical line test.
The equation x equals y squared does not represent a function as it fails the vertical line test by touching a vertical line at more than one point.
A parabola, y equals x squared, passes the vertical line test and thus represents a function.
A circle with the equation x squared plus y squared equals nine is not a function because it touches a vertical line at two points.
The vertical line x equals four does not represent a function as it touches a vertical line at an infinite number of points.
The square root of x and the absolute value of x both represent functions as they pass the vertical line test.
The graph of sine x does not pass the vertical line test and therefore is not a function.
The functions x cubed and the cube root of x both pass the vertical line test and are thus considered functions.
Another example is provided to illustrate that a graph touching a vertical line at two points does not represent a function.
The vertical line test is a method to determine if a graph represents a function by checking if any vertical line intersects the graph at most once.
The video provides a comprehensive overview of various mathematical functions and their graphical representations in relation to the vertical line test.
Understanding the vertical line test is crucial for distinguishing between functions and non-functions in graphical analysis.
The video offers clear examples and explanations, making it an educational resource for learning about functions and their graphical interpretations.
The concept of functions and their graphical tests, like the vertical line test, is fundamental in mathematics, particularly in algebra and calculus.
The video's approach to explaining the vertical line test is both systematic and easy to follow, enhancing the viewer's understanding of the topic.
By the end of the video, viewers will have a solid grasp of how to apply the vertical line test to various graphs to ascertain if they represent functions.
The video serves as an effective educational tool for anyone seeking to understand the basics of functions and their graphical analysis.
Transcripts
Browse More Related Video
Using the Vertical Line Test (Precalculus - College Algebra 6)
Ch. 2.2 Graphs of Functions
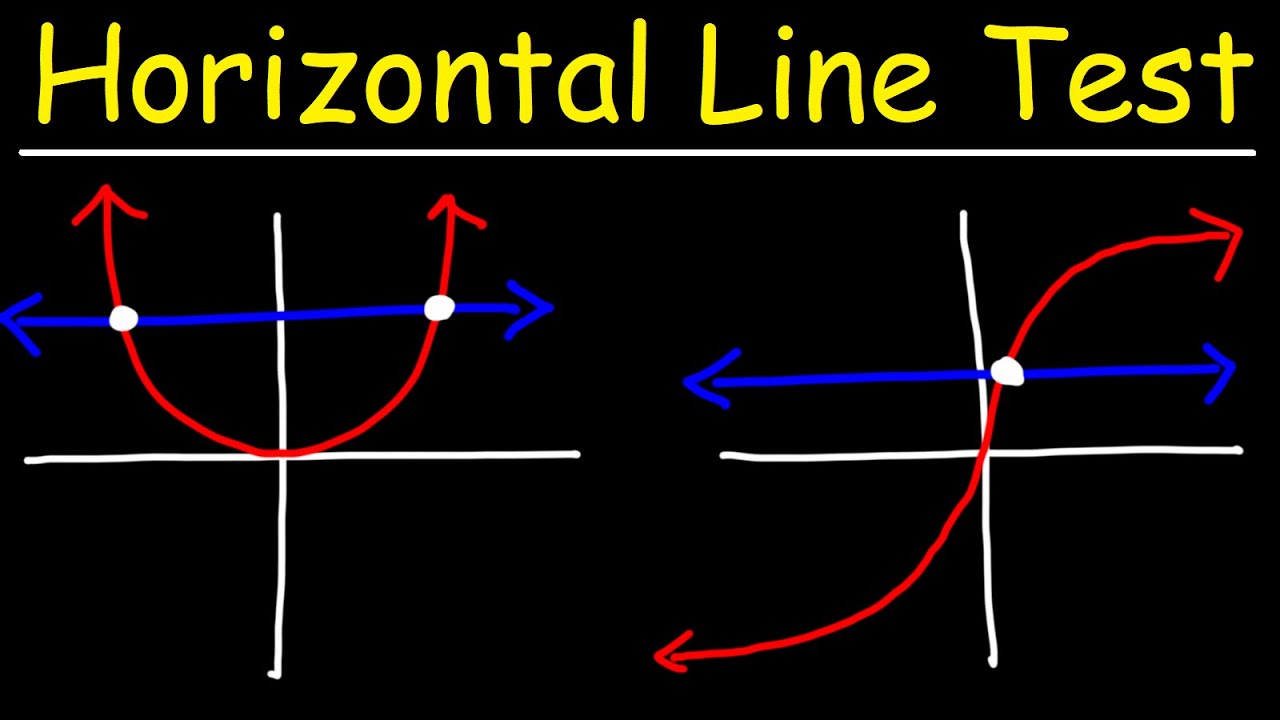
Horizontal Line Test and One to One Functions
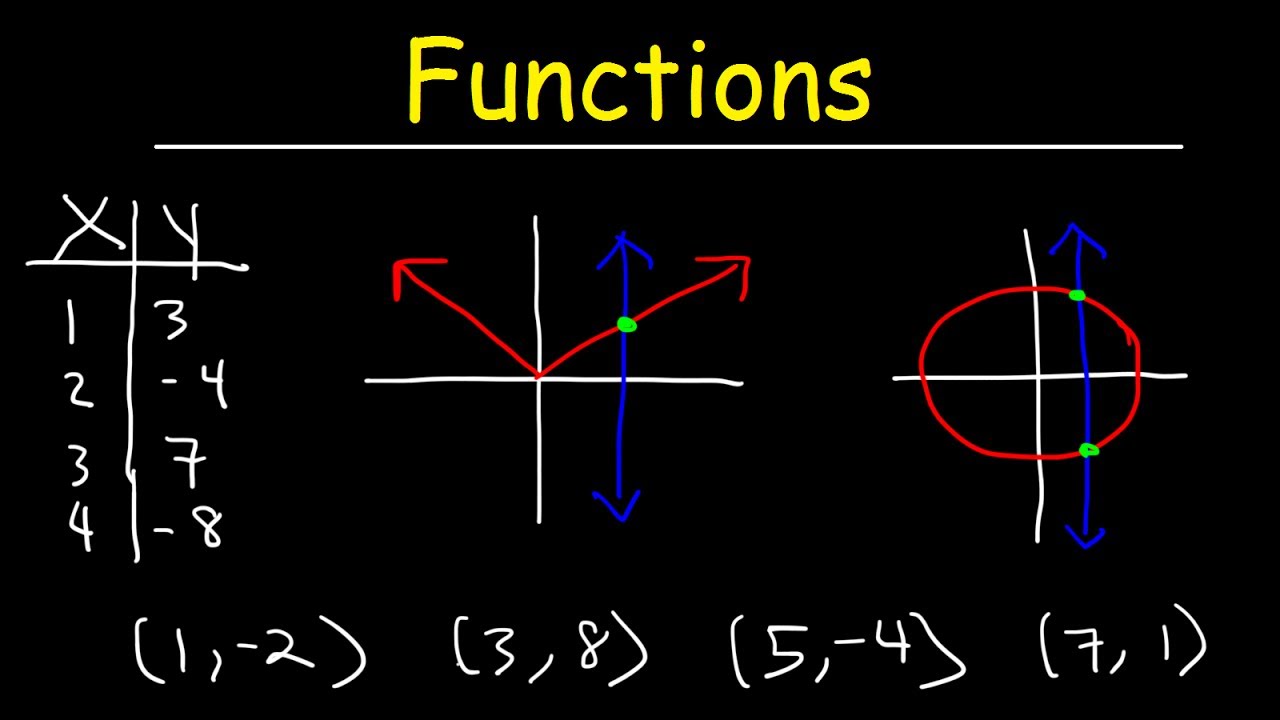
Functions - Vertical Line Test, Ordered Pairs, Tables, Domain and Range

Calculus - Lesson 6 | What are Functions? | Don't Memorise
One to One Functions (Precalculus - College Algebra 50)
5.0 / 5 (0 votes)
Thanks for rating: