Ch. 2.2 Graphs of Functions
TLDRThis lecture introduces the concept of graphing functions, emphasizing the importance of understanding the 'library of functions' as fundamental tools in algebra and calculus. The instructor covers basic polynomial functions, exponential, logarithmic, reciprocal, square root, and absolute value functions, and explains the vertical line test to determine if a graph represents a function. The lecture also demonstrates how to graph and evaluate piecewise functions, highlighting the need to graph each piece separately to ensure the graph accurately represents the function.
Takeaways
- 📚 The lecture introduces the concept of graphing functions, emphasizing the importance of understanding the basic forms of functions for algebra and calculus courses.
- 📈 The 'library of functions' is presented as a crucial tool for graphing, which includes basic functions used throughout algebra.
- 🔍 The script explains how to transform basic functions into more complex forms encountered in calculus problems.
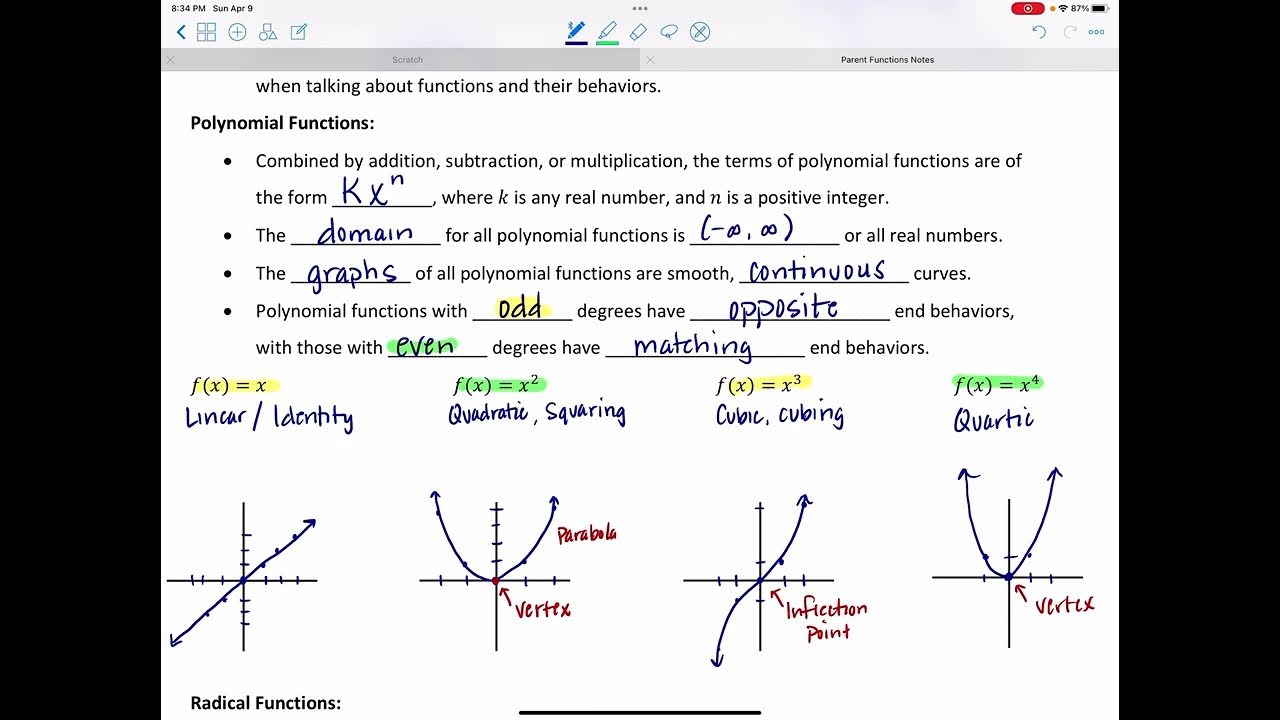
- 📉 The basic forms of functions discussed include linear (f(x) = x), quadratic (f(x) = x^2), cubic (f(x) = x^3), and reciprocal (f(x) = 1/x) functions.
- 🔺 The importance of higher degree polynomials is highlighted, with the script mentioning that they will be explored in more detail in later chapters.
- 📊 The reciprocal squared function (f(x) = 1/x^2) is introduced, noting that it differs from the basic reciprocal function by being always positive.
- 📈 The exponential function (f(x) = 2^x) and its inverse, the logarithmic function, are mentioned as fundamental in understanding transformations.
- 🔄 The square root function is identified as the inverse of the square function, and the absolute value function is discussed in terms of its graphical representation.
- 🚫 The vertical line test is explained as a method to verify if a graph represents a function, ensuring that no vertical line intersects the graph more than once.
- 📍 The process of reading a graph is described, using the notation of x and f(x) to identify points, with f(x) representing the output when x is the input.
- 📝 The concept of piecewise functions is explored, with an example provided to demonstrate how to graph and evaluate them by considering different segments of the function.
Q & A
What is the main topic of Section 2.2 in the transcript?
-The main topic of Section 2.2 is the graphs of functions, including a discussion of the library of basic functions and their transformations.
What is the purpose of the 'library of functions' mentioned in the transcript?
-The 'library of functions' is a collection of basic functions used throughout algebra and calculus. It serves as a reference for understanding and transforming functions in various mathematical problems.
Which function is considered the most basic form of a linear function?
-The most basic form of a linear function is f(x) = x, which can be transformed by applying different coefficients and constants.
What is the significance of the vertical line test in the context of the transcript?
-The vertical line test is used to determine if a graph represents a function. If any vertical line intersects the graph at more than one point, the graph does not represent a function.
How does the concept of a piecewise function relate to the idea of graphing functions in pieces?
-A piecewise function is defined and graphed in different segments or 'pieces', each with its own rule or function. It is important to graph each piece separately to ensure the graph accurately represents the function.
What is the difference between the graphs of the functions f(x) = x and f(x) = x^2?
-The graph of f(x) = x is a straight line with a slope of 1, while the graph of f(x) = x^2 is a parabola opening upwards, representing a quadratic function.
Why is the reciprocal function, 1/x, considered important in the context of rational expressions?
-The reciprocal function, 1/x, is important because any rational expression can be seen as a manipulation of this basic function, making it a fundamental concept in understanding rational functions.
How does the graph of the function f(x) = 1/x^2 differ from the graph of f(x) = 1/x?
-The graph of f(x) = 1/x^2 is similar to that of f(x) = 1/x, but all values are positive since the square of x is always positive, meaning there are no negative outputs.
What is the relationship between exponential functions and logarithmic functions as mentioned in the transcript?
-Exponential functions and logarithmic functions are inverses of each other. This means that applying an exponential function and then its corresponding logarithm (or vice versa) will result in the original input value.
Can you provide an example of how to read a point on a graph of a function from the transcript?
-To read a point on a graph of a function, you identify the input value 'x' and then find the corresponding output value 'f(x)' by drawing a horizontal line from the point on the graph to the y-axis.
What is the process for graphing a piecewise function as described in the transcript?
-To graph a piecewise function, you graph each segment separately, ensuring that the graph only includes the parts of the function that are defined for each interval. You must also pay attention to whether endpoints are included or excluded, indicated by closed or open dots, respectively.
Outlines
📚 Introduction to Graphs of Functions
This paragraph introduces Section 2.2, focusing on the graphs of functions. The instructor emphasizes the importance of understanding the 'library of functions,' which are the basic functions used in algebra and throughout various calculus courses. The library includes linear functions (f(x) = x), quadratic (f(x) = x^2), cubic (f(x) = x^3), reciprocal (f(x) = 1/x), squared reciprocal (f(x) = 1/x^2), exponential (f(x) = 2^x), logarithmic, square root, and absolute value functions. The instructor also explains the concept of the vertical line test to determine if a graph represents a function, illustrating that a function's graph should not intersect any vertical line more than once.
📈 Understanding Graphs and Piecewise Functions
The second paragraph delves into how to read and interpret graphs of functions, highlighting the transition from using 'y' to 'f(x)' notation. The instructor explains how to find points on a graph using 'x' and 'f(x)' and introduces the concept of piecewise functions. These functions are defined and graphed in segments, with different expressions for different intervals of 'x'. An example of a piecewise function is given, consisting of a constant, linear, quadratic, and exponential segment. The instructor demonstrates how to graph each segment separately, ensuring that the graph adheres to the function's definition and uses open and closed circles to indicate inclusion or exclusion of endpoints.
📉 Graphing Techniques for Piecewise Functions
The final paragraph continues the discussion on piecewise functions, focusing on the graphing techniques. The instructor provides a step-by-step guide on how to graph each piece of the function, ensuring that the graph accurately reflects the function's definition over specified intervals. The importance of erasing overlapping parts of the graph that do not belong to the function is stressed. The paragraph concludes with the instructor's intention to continue the discussion in the next video, leaving the audience with a clear understanding of how to evaluate and graph piecewise functions both algebraically and graphically.
Mindmap
Keywords
💡Graphs of functions
💡Library of functions
💡Linear function
💡Quadratic function
💡Polynomials
💡Reciprocal function
💡Exponential function
💡Logarithm
💡Square root function
💡Absolute value function
💡Vertical line test
💡Piecewise function
Highlights
Introduction to Section 2.2 on graphing functions and the importance of understanding basic function graphs.
Discussion on the library of functions as a fundamental tool in algebra and calculus courses.
Explanation of the basic linear function graph, f(x) = x, and its transformations.
Introduction to the standard quadratic function graph, f(x) = x^2.
Importance of the x cube function and its role in higher chapters of calculus.
Introduction of the reciprocal function, 1/x, and its variations in rational expressions.
Graphing the function 1/x^2 and its distinction from 1/x due to the absence of negative values.
Introduction to the basic exponential function graph, 2^x.
The relationship between logarithms and exponentials as inverse functions.
Graphing the square root function, the inverse of the square function.
Exploring the absolute value function and its significance in equations and inequalities.
The vertical line test to verify if a graph represents a function by ensuring no vertical line intersects more than once.
How to read a graph using points (x, f(x)) to identify outputs from a function.
Introduction to piecewise functions and their definition in segments.
Graphing a piecewise function step by step, ensuring each segment is represented correctly.
The importance of correctly graphing endpoints in piecewise functions with closed and open dots.
Evaluating piecewise functions algebraically by ensuring inputs are evaluated at the proper segment.
Transcripts
Browse More Related Video

Vertical Line Test
Parent Functions
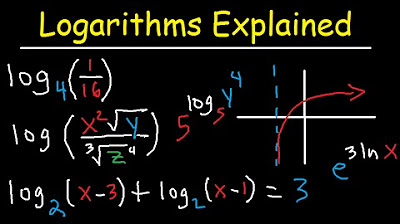
Logarithms Explained Rules & Properties, Condense, Expand, Graphing & Solving Equations Introduction
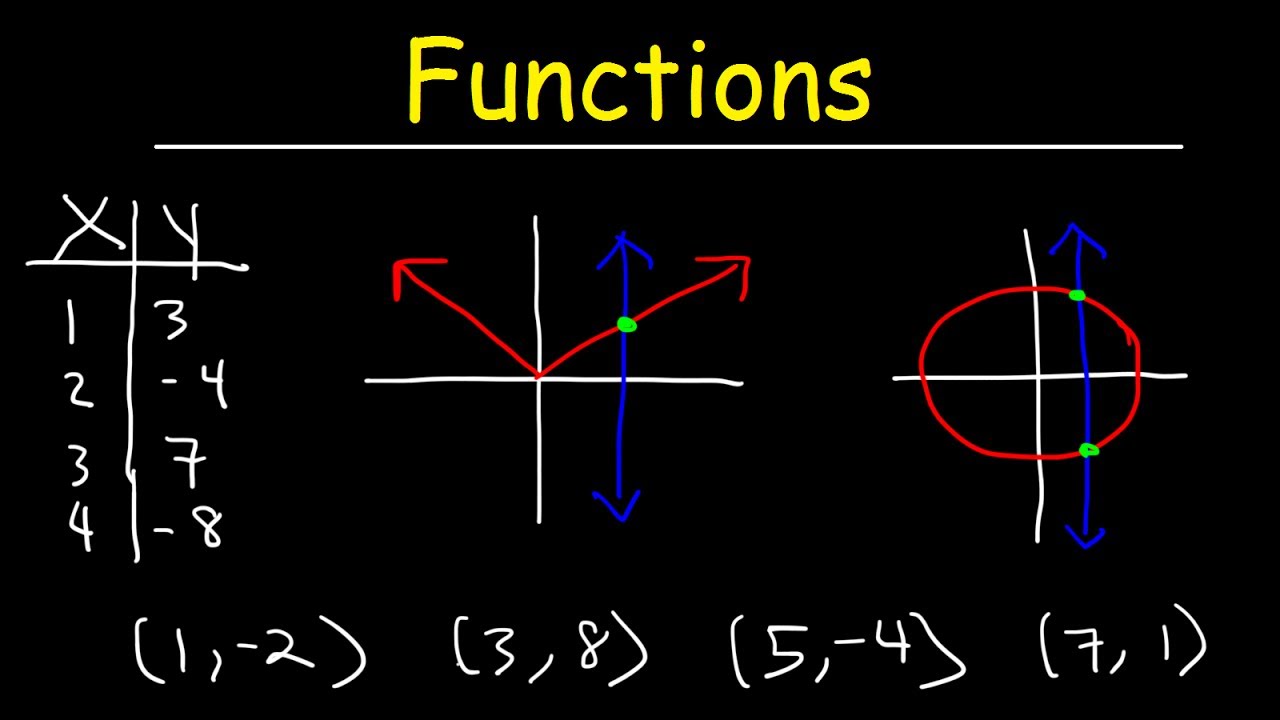
Functions - Vertical Line Test, Ordered Pairs, Tables, Domain and Range

Precalculus Introduction, Basic Overview, Graphing Parent Functions, Transformations, Domain & Range
Piecewise Functions
5.0 / 5 (0 votes)
Thanks for rating: