Using the Vertical Line Test (Precalculus - College Algebra 6)
TLDRThe video script discusses the concept of the vertical line test, a method used to determine if a graph represents a function. It emphasizes understanding why the test works rather than just how to perform it. The vertical line test operates on the principle that a function allows one input to correspond to exactly one output. By examining a graph, if any vertical line intersects the graph more than once, it indicates that the graph does not represent a function, as a function requires a single output for each input. The script also clarifies that having no output for an input is still consistent with the definition of a function, as seen with the square root function which does not have real outputs for negative inputs. The video aims to help viewers retain knowledge by understanding the underlying principles of mathematical concepts.
Takeaways
- 📐 The Vertical Line Test is a method to determine if a graph represents a function.
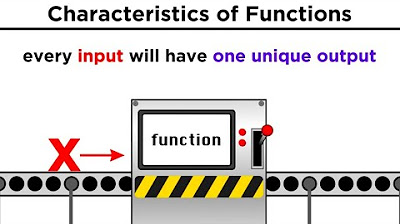
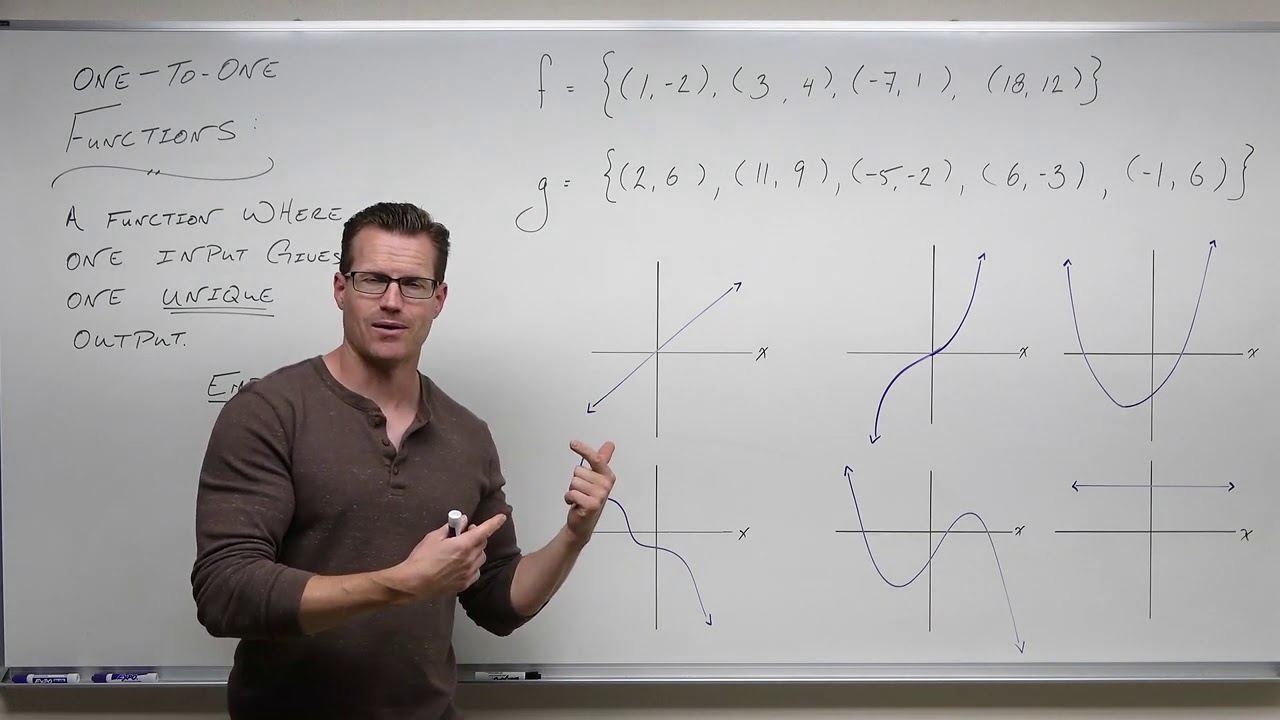
- 🔍 A function is defined by having exactly one output for every input.
- 🔑 To perform the test, you check if any vertical line intersects the graph more than once.
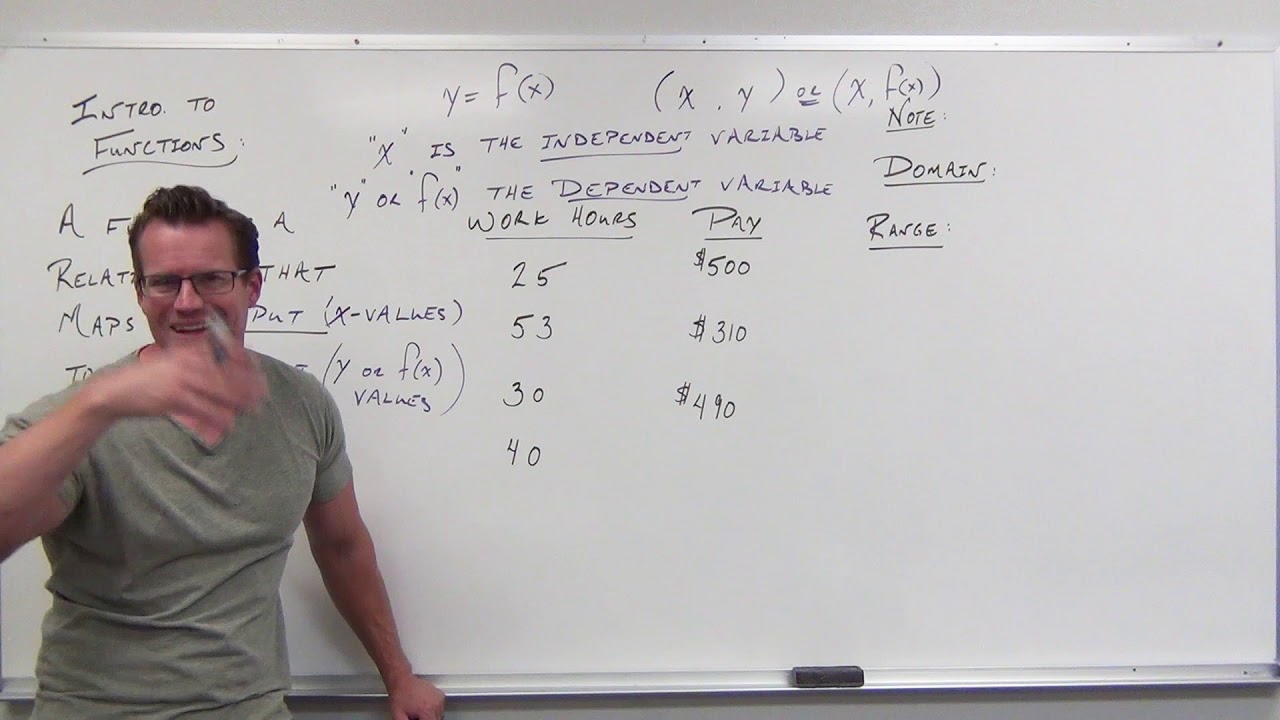
- ↕️ The input values are on the horizontal axis, and the output values are on the vertical axis.
- 🤔 Understanding why the Vertical Line Test works helps in retaining knowledge.
- 🈁 For every chosen input on the horizontal axis, there should be a single corresponding output on the vertical axis.
- ✅ If a graph passes the Vertical Line Test (only one output per input), it is a function.
- ❌ If a graph fails the test (more than one output for an input), it is not a function.
- ⚠️ Even if there are no outputs for certain inputs (like negative numbers for square roots), the graph can still represent a function.
- 📈 The test is especially useful for checking piecewise functions to ensure there are no accidental overlaps.
- 🧐 The interplay between inputs and outputs is crucial for understanding the concept of a function.
Q & A
What is the vertical line test?
-The vertical line test is a method used to determine whether a graph represents a function. It works by checking if any vertical line intersects the graph more than once. If it does, the graph does not represent a function because a function requires each input to have exactly one output.
Why is understanding why the vertical line test works important?
-Understanding why the vertical line test works helps in retaining knowledge by grasping the underlying concept. It emphasizes the relationship between inputs and outputs in functions, which is crucial for determining if a graph is functional.
How does the rectangular coordinate system relate to the vertical line test?
-In the rectangular coordinate system, the input axis is horizontal and the output axis is vertical. This setup is fundamental to the vertical line test, as it allows for the examination of whether each input on the horizontal axis corresponds to a single output on the vertical axis.
What does it mean if a graph passes the vertical line test?
-If a graph passes the vertical line test, it means that for every point on the horizontal axis (each input), there is only one point on the vertical axis (output) that the graph intersects. This indicates that the graph represents a function.
What happens if a graph fails the vertical line test?
-If a graph fails the vertical line test, it means that there is at least one point on the horizontal axis where the graph intersects the vertical axis at more than one point. This indicates that the graph does not represent a function because it does not satisfy the condition of one output per input.
Can a graph have no outputs for an input and still be considered a function?
-Yes, a graph can have no outputs for an input and still be considered a function. This situation can occur with functions like the square root, where negative inputs do not produce real number outputs and thus do not appear on the graph of a real coordinate plane.
What is the significance of the horizontal axis in the context of the vertical line test?
-The horizontal axis represents the input values for a function. In the vertical line test, one examines every point along the horizontal axis to determine if for each input, there is a single corresponding output on the vertical axis.
What is the role of the vertical axis in the vertical line test?
-The vertical axis represents the output values of a function. During the vertical line test, one checks if for each input on the horizontal axis, there is exactly one output on the vertical axis, ensuring the graph represents a function.
How does the vertical line test help when graphing piecewise functions?
-The vertical line test helps to ensure that there are no accidental overlaps or repeats in the graph of a piecewise function. It verifies that each segment of the function adheres to the rule of one output per input, maintaining the integrity of the function's definition.
Can the vertical line test be applied to graphs with vertical lines?
-The vertical line test can be conceptually applied to graphs with vertical lines, but it is not typically useful because a vertical line on a graph would represent a function where every point along the line is an output for a single input, which by definition is not a function.
Why is it important to understand the concept of functions when learning about the vertical line test?
-Understanding the concept of functions is important because it provides the foundational knowledge for the vertical line test. Knowing that a function assigns exactly one output to each input is essential for using the test to determine whether a given graph represents a function.
Outlines
📐 Understanding the Vertical Line Test
This paragraph introduces the concept of the vertical line test, a method for determining if a graph represents a function. The focus is on why the test works, rather than just how to perform it. The test is based on the principle that for any given input (horizontal axis), a function will yield exactly one output (vertical axis). If a vertical line intersects the graph at more than one point, it indicates that the graph does not represent a function, as a function requires a single output for each input.
🔍 Applying the Vertical Line Test to Graphs
The second paragraph delves into applying the vertical line test to various graphs. It explains that when a graph is tested with vertical lines and each line intersects the graph at only one point for every chosen input, the graph represents a function. Conversely, if a vertical line intersects the graph at more than one point for a given input, the graph does not represent a function. The paragraph also clarifies that it's acceptable for a function to have no output for certain inputs, as in the case of square roots for negative numbers.
🚫 Non-Function Graphs and the Vertical Line Test
The final paragraph discusses the implications of the vertical line test for graphs that fail the test. It emphasizes that if a graph has multiple outputs for a single input, it cannot be a function. The paragraph also touches on the case of square root functions, where some inputs do not yield real number outputs, but this does not disqualify the graph as a function. The vertical line test is presented as a useful tool for verifying the function nature of graphs, especially when dealing with piecewise functions.
Mindmap
Keywords
💡Vertical Line Test
💡Function
💡Input and Output
💡Graph
💡Coordinate Plane
💡Horizontal Axis
💡Vertical Axis
💡Piecewise Functions
💡Non-Function
💡Square Root
💡Imaginary Numbers
Highlights
The vertical line test is a method to determine if a graph represents a function.
Understanding why the vertical line test works helps in retaining knowledge through comprehension.
A function is defined by having one output for every given input.
The input axis is horizontal, and the output axis is vertical in the rectangular coordinate system.
For any given input, the output will be located somewhere above or below on the vertical axis.
The vertical line test checks a graph by selecting a point on the horizontal axis and looking above and below for outputs.
If a single input results in two outputs, the graph does not represent a function.
The test is based on the principle that functions should have a one-to-one correspondence between inputs and outputs.
The video emphasizes the importance of understanding the interplay between inputs and outputs.
The vertical line test can be applied to the entire graph to verify if it's a function.
The video demonstrates how to apply the vertical line test to various graphs to determine their functional nature.
A graph passes the vertical line test if every vertical line intersects the graph at most once.
The video clarifies that a graph can still be a function even if certain inputs have no corresponding outputs.
The concept of square roots and their graphical representation is used to illustrate the test's flexibility.
The video explains that the vertical line test is particularly useful when graphing piecewise functions.
The test ensures that there are no accidental overlaps in a graph that would disqualify it as a function.
The video concludes by reinforcing the practical applications of the vertical line test in graphing and function analysis.
Transcripts


5.0 / 5 (0 votes)
Thanks for rating: