Functions - Vertical Line Test, Ordered Pairs, Tables, Domain and Range
TLDRThis video script delves into the concept of functions and the vertical line test. It explains that a function is a unique relationship where every x value corresponds to exactly one y value, using tables to illustrate this. The script guides viewers on how to identify functions from non-functions, discusses domain and range, and introduces the vertical line test for graph analysis. It also promotes an algebra course on Udemy, covering topics from basic arithmetic to complex numbers and sequences, with quizzes for each section to reinforce learning.
Takeaways
- 📌 A function is a unique relationship between x and y values where each x value corresponds to exactly one y value.
- 🔍 To determine if a relation is a function, ensure no x value is repeated with different y values.
- 📊 The video provides tables to illustrate the function relationship, showing which tables represent functions and which do not.
- 👀 The vertical line test is a method to determine if a graph represents a function: a vertical line should intersect the graph at no more than one point.
- 📈 The domain of a function includes all the unique x values, while the range consists of all the y values.
- 📝 The script explains how to find the domain and range from a set of ordered pairs.
- 📚 The video script also discusses ordered pairs and how to use them to identify if a relation is a function.
- 📉 The video uses graphs to visually demonstrate the vertical line test and to show examples of functions and non-functions.
- 📐 It is mentioned that a linear graph and a single point touch represent functions, while a complete circle does not.
- 🎓 The speaker promotes an algebra course on Udemy, covering various topics from basic arithmetic to complex numbers and sequences.
- 📑 Each section of the algebra course comes with a quiz to help reinforce learning and prepare for tests.
Q & A
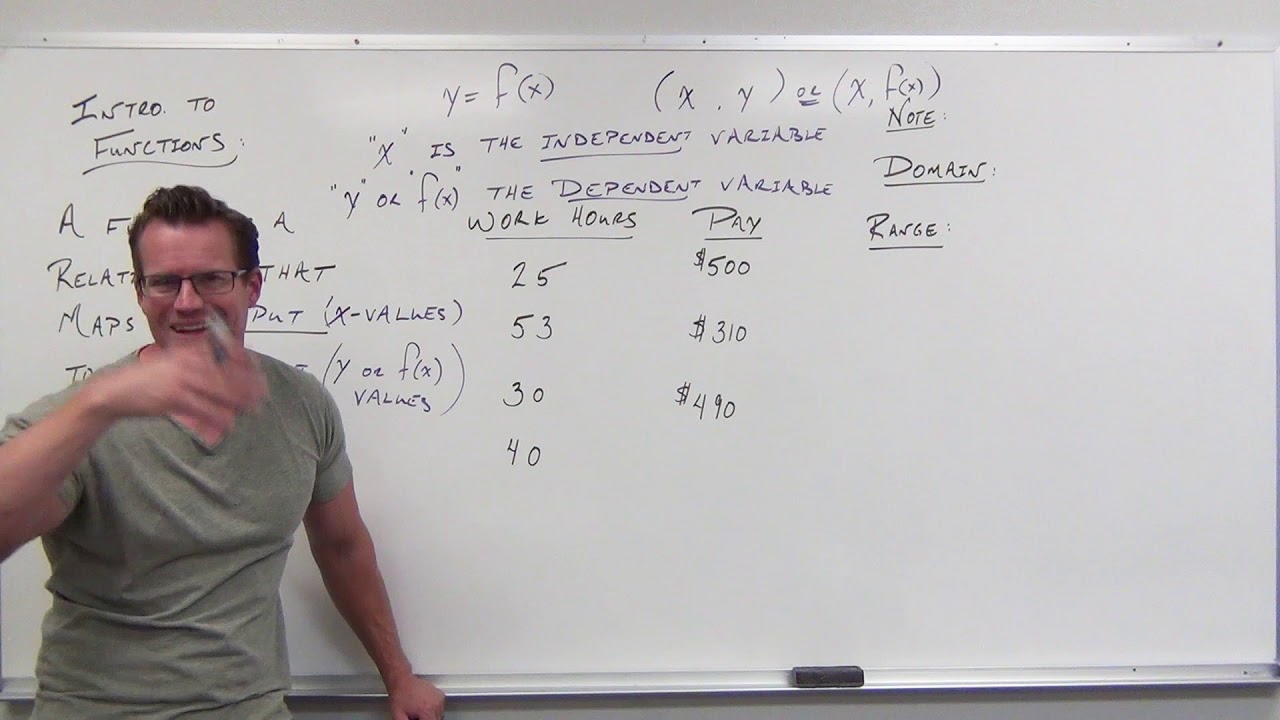
What is a function in the context of mathematics?
-A function is a special relationship between x and y values where every x value corresponds to exactly one y value. No single x value can have two different y values.
How can you determine if a relation is a function by using tables?
-To determine if a relation is a function by using tables, check if there are any repeated x values with different y values. If there are no repeated x values, then it is a function.
What is the vertical line test, and how does it help in determining if a graph represents a function?
-The vertical line test is a method used to determine if a graph represents a function. If a vertical line intersects the graph at more than one point, the graph does not represent a function. If it intersects at only one point, it does represent a function.
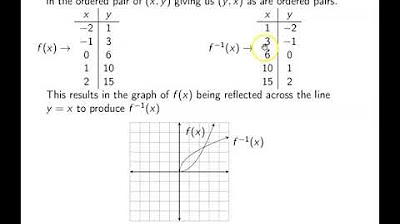
How do you identify a function from a set of ordered pairs?
-To identify a function from a set of ordered pairs, ensure that there are no repeated x values. If each x value appears only once, the set represents a function.
What is the domain of a function, and how can you find it from a set of ordered pairs?
-The domain of a function is the set of all possible x values. To find the domain from a set of ordered pairs, list all unique x values present in the set.
What is the range of a function, and how can you determine it from a set of ordered pairs?
-The range of a function is the set of all possible y values. To determine the range from a set of ordered pairs, list all unique y values and arrange them in ascending order.
Can a function have multiple y values corresponding to different x values?
-Yes, a function can have multiple y values corresponding to different x values, as long as there are no two x values that correspond to two different y values.
What is the significance of the vertical line test in graphing functions?
-The vertical line test is significant in graphing functions as it provides a quick way to determine if a curve or graph represents a function. Only graphs that pass the vertical line test (intersecting at one point) are considered functions.
How can you use the vertical line test on a linear graph to determine if it represents a function?
-For a linear graph, if a vertical line touches the graph at only one point, it represents a function. If it touches at more than one point, it does not represent a function.
Why is a complete circle not considered a function according to the vertical line test?
-A complete circle is not considered a function because, according to the vertical line test, any vertical line drawn through the circle will intersect it at two points, indicating that it does not satisfy the criteria of a function.
What additional topics are covered in the mentioned algebra course on Udemy?
-The algebra course on Udemy covers topics such as basic arithmetic, fractions, linear equations, order of operations, graphing linear equations, inequalities, polynomials, factoring, systems of equations, quadratic equations, rational and radical expressions, complex and imaginary numbers, exponential functions, logarithms, functions in general, conic sections, and sequences and series.
Outlines
📊 Understanding Functions and the Vertical Line Test
This paragraph explains the concept of a function, emphasizing that each x-value must correspond to exactly one y-value. It uses tables to illustrate examples of functions and non-functions. It further discusses identifying functions by checking for repeated x-values and provides multiple examples for practice. The paragraph also introduces the method of determining if a relation is a function using ordered pairs.
📉 Domain and Range of Functions
The paragraph defines the domain as the set of all x-values and the range as the set of all y-values of a function, using ordered pairs as examples. It explains how to identify the domain and range and emphasizes the importance of writing values in ascending order. It also introduces the vertical line test to determine if a graph represents a function, providing various examples for practice.
📚 Overview of Algebra Course Content
This paragraph introduces an algebra course available on Udemy, detailing its comprehensive content. It covers basic arithmetic, fractions, linear equations, order of operations, inequalities, absolute value expressions, polynomials, factoring, systems of equations, quadratic equations, rational and radical expressions, complex numbers, exponential functions, logarithms, and functions, including vertical and horizontal line tests. The course includes video quizzes and extensive sections on various algebraic topics, ensuring thorough preparation for exams.
Mindmap
Keywords
💡Function
💡Vertical Line Test
💡Domain
💡Range
💡Ordered Pairs
💡Tables
💡Graphs
💡Algebra Course
💡Slope
💡Quadratic Equations
Highlights
Introduction to functions and the vertical line test.
Definition of a function: a special relationship where each x value corresponds to exactly one y value.
Explanation of how a table can illustrate the relationship of a function.
Example showing a table where a single x value corresponds to two different y values, making it not a function.
Illustration of a valid function with no repeating x values.
Three tables given to identify which relations are functions.
Explanation on how repeated x values indicate a relation is not a function.
Discussion on determining if a set of ordered pairs is a function.
Definition and examples of domain and range in a function.
Vertical line test explained to determine if a graph represents a function.
Example graphs used to practice the vertical line test.
Promotion of an algebra course on Udemy.
Course content includes basic arithmetic, fractions, linear equations, and more.
Details on specific sections of the course, such as solving linear equations and graphing linear equations.
Overview of additional course topics like inequalities, polynomials, and quadratic equations.
Final sections of the course cover complex numbers, exponential functions, and conic sections.
Transcripts


5.0 / 5 (0 votes)
Thanks for rating: