Why We Divide by N-1 in the Sample Variance (Standard Deviation) Formula | The Bessel's Correction
TLDRThe video script delves into the concept of bias correction in statistics, specifically explaining the rationale behind using 'n minus 1' in the formula for calculating sample variance. It distinguishes between a sample and a population, emphasizing that the bias correction is necessary when estimating variance from a sample due to the underestimation that occurs when using the sample mean instead of the population mean. The video uses examples and the concept of degrees of freedom to clarify why dividing by 'n minus 1' compensates for this underestimation, ultimately leading to a closer estimate of the true population variance.
Takeaways
- 📊 Understanding the difference between a sample and a population is crucial in statistics.
- 🔢 When estimating the population variance from a sample, the bias correction (n-1) is applied to avoid underestimation.
- 📈 The division by n (sample size) instead of n-1 in the variance formula can lead to biased results.
- 🤔 The concept of degrees of freedom explains the reason behind dividing by n-1; it accounts for the information lost when estimating the population mean with the sample mean.
- 🌟 If the true mean of the population were known, no bias correction would be necessary when estimating the variance.
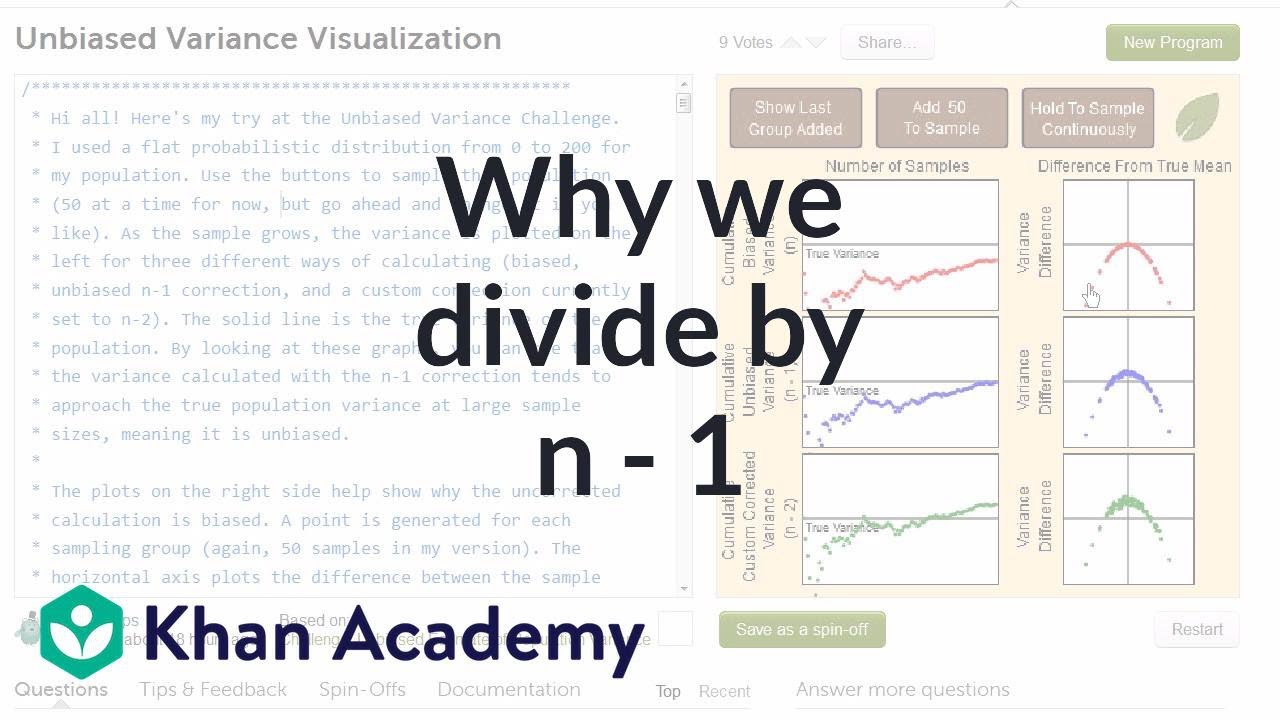
- 📊 Repeated sampling and averaging the variances from these samples can approximate the population variance more closely.
- 🔄 In practice, the bias correction (n-1) is often used to adjust the sample variance to better reflect the population variance.
- 📐 Small sample sizes tend to be closer to the sample mean than the population mean, hence the need for the n-1 adjustment.
- 🧠 Developing an intuition for the bias correction can enhance understanding and application in statistical analysis.
- 🔍 The video provides examples and explanations to help build this intuition around the bias correction concept.
- 👍 The video encourages viewers to engage by liking, disliking, and commenting on the content for further discussion.
Q & A
What is the main topic of the video?
-The main topic of the video is bias correction, specifically the reason behind dividing by n minus 1 instead of n in the equation that calculates the sample variance.
What is the difference between a sample and its corresponding population?
-A sample is a subset of data taken from a larger population with the intention of inferring characteristics about the population. The population is the entire set of data points or individuals from which the sample is drawn.
Why is it important to understand the difference between a sample and a population?
-Understanding the difference is crucial because it affects how we calculate variance. If we have access to the entire population data, we do not apply bias correction. However, if we are estimating variance from a sample, we must apply the Bessel's bias correction to get a more accurate result.
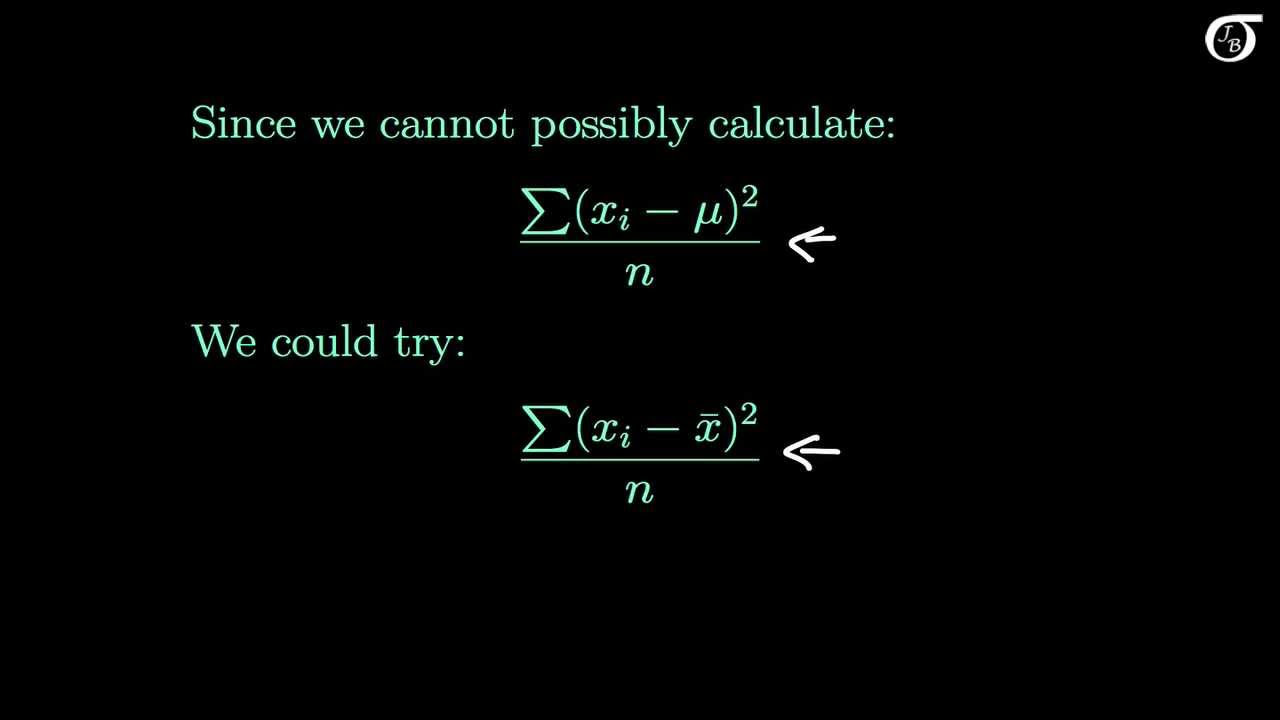
What happens when we use the sample mean to estimate population variance?
-Using the sample mean to estimate population variance typically results in an underestimation of the true population variance because the data points in a sample tend to be closer to the sample mean than to the population mean.
What is Bessel's bias correction and when do we apply it?
-Bessel's bias correction is a method used to adjust the calculation of sample variance to account for the underestimation that occurs when using the sample mean instead of the population mean. It is applied when we estimate variance using information from a sample rather than the entire population.
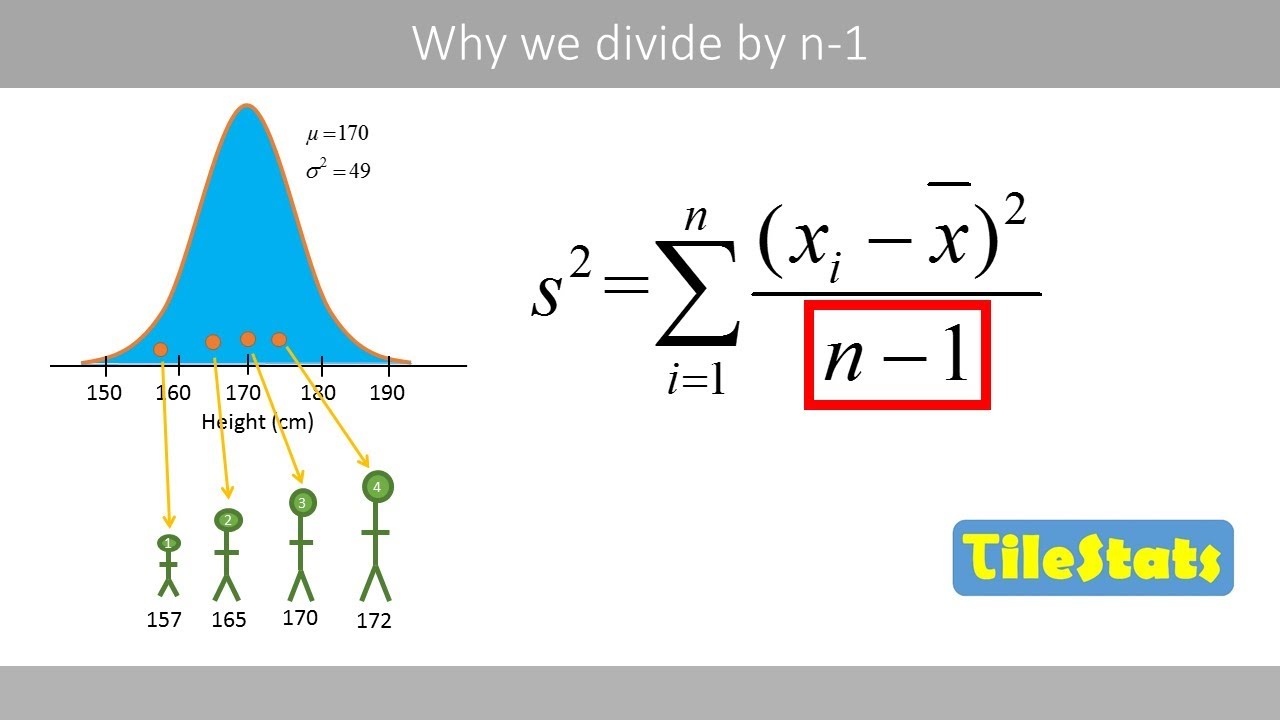
How does the video illustrate the concept of Bessel's bias correction?
-The video uses an example of estimating the variance of heights in a country. It shows that without bias correction, the calculated variance from samples is lower than the actual population variance. By multiplying the variance by the sample size and dividing by the sample size minus one, the result is closer to the population variance.
What is the mathematical proof behind Bessel's bias correction?
-The mathematical proof shows that the uncorrected sample variance is always equal to the population variance multiplied by (n - 1) / n, where n is the sample size. This underestimation is why we multiply the sample variance by n and divide by n - 1 to get a better estimate of the population variance.
What does the term 'degrees of freedom' mean in the context of this video?
-In the context of this video, 'degrees of freedom' refers to the number of independent data points that can vary in a dataset. When estimating the population mean with the sample mean, one degree of freedom is lost, hence the division by n - 1 in the variance formula.
How does the video's example with two height samples illustrate the concept of degrees of freedom?
-The example shows that when we calculate the mean of two height samples, the distances to the sample mean are smaller compared to the population mean. This indicates that the sample mean restricts the variability, thus reducing the degrees of freedom by one, leading to the need for the division by n - 1.
What is the significance of the video's suggestion to multiply the variance by 4 and divide by 3 when repeating the experiment with multiple samples?
-This process is a method to average the variances obtained from multiple samples. It helps to get closer to the actual population variance by compensating for the bias introduced by using the sample mean instead of the population mean.
How does the video conclude the explanation of Bessel's bias correction?
-The video concludes by emphasizing that when estimating the population variance with the sample mean, we lose one degree of freedom, which is why we divide by the sample size minus one in the variance formula.
Outlines
📊 Understanding Bias Correction in Variance Calculation
This paragraph introduces the concept of bias correction in statistics, specifically focusing on the bezel correction. It explains the importance of distinguishing between a sample and its corresponding population. The speaker clarifies that when estimating the population variance using sample data, the bias correction (dividing by n-1 instead of n) is necessary to avoid underestimating the true variance. The paragraph also touches on the fact that if the true population mean were known, no bias correction would be needed. An example is provided to illustrate how not using the bias correction leads to an underestimated variance, and the concept of degrees of freedom is introduced to explain the rationale behind dividing by n-1 in the variance formula.
🔢深入探讨样本均值与总体均值在方差估计中的差异
本段落深入探讨了使用样本均值而非总体均值来估计方差时的差异。首先,通过一个极端的例子,说明了仅抽取两个样本时,样本均值与总体均值的差异,以及样本均值与样本数据点的距离通常小于与总体均值的距离。接着,通过一个包含三个数据点的样本来解释自由度的概念,说明了为什么在估计方差时,使用样本均值会导致自由度的减少,从而需要通过n-1来调整分母。最后,视频以对观众的感谢和鼓励观众反馈结束,同时提醒观众关注频道以获取新内容。
Mindmap
Keywords
💡Bias Correction
💡Sample
💡Population
💡Variance
💡Bezel Correction
💡Degrees of Freedom
💡Sample Mean
💡Population Mean
💡Underestimation
💡Statistical Inference
💡Data Analysis
Highlights
The discussion focuses on bias correction in the variation formula, specifically the 'Bezel correction'.
Exploring the reason behind dividing by 'n-1' rather than 'n' in the sample variance equation.
Understanding the difference between a sample and the corresponding population is crucial in statistics.
Due to limited access to entire population data, samples are used to gain insights into population characteristics.
The necessity of bias correction when estimating variance using sample information is highlighted.
Employing bias correction is not needed if the true mean of the population is known.
An example is provided to illustrate the underestimation of population variance without bias correction.
The concept of degrees of freedom and its relation to sample size in variance estimation is discussed.
The video aims to build an intuition around the mathematical concepts for better understanding.
A more extreme example with two height samples is used to demonstrate the loss of degrees of freedom.
The difference between using sample mean and population mean in terms of degrees of freedom is clarified.
The practical application of the variance formula is explained through the example of a sample of three.
The video concludes with an explanation of why 'n-1' is used in the variance formula when estimating population variance.
The importance of understanding the 'n-1' division for accurate statistical analysis is emphasized.
The video encourages viewers to engage by liking, disliking, and commenting on the content.
A call to action is made for viewers to subscribe for updates on new content.
Transcripts
Browse More Related Video
The Sample Variance: Why Divide by n-1?
Dividing By n-1 Explained
Why do we divide by n-1 and not n? | shown with a simple example | variance and sd
Another simulation giving evidence that (n-1) gives us an unbiased estimate of variance
Statistics: Sample variance | Descriptive statistics | Probability and Statistics | Khan Academy
Review and intuition why we divide by n-1 for the unbiased sample | Khan Academy
5.0 / 5 (0 votes)
Thanks for rating: