Dividing By n-1 Explained
TLDRThe video script by Michael Corayer explains the concept of Bessel's Correction, which involves dividing by n-1 instead of n when estimating variance. The explanation focuses on the conceptual understanding of why using the sample mean (X bar) tends to underestimate the sum of squared deviations from the population mean (mu). The video clarifies that this underestimation occurs because the sample mean itself is a part of the data, reducing the degrees of freedom by one. As sample size increases, the underestimation becomes less significant, but dividing by n-1 provides a more accurate adjustment for this bias in most cases.
Takeaways
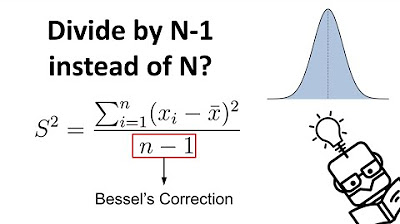
- 📊 Understanding Bessel's Correction: Dividing by n-1 rather than n when estimating variance helps to correct for the underestimation that occurs when using the sample mean (X bar) instead of the population mean (mu).
- 🔍 Conceptual Explanation: The script emphasizes the importance of understanding the underlying logic of why n-1 provides a better estimate than n, rather than relying on made-up examples.
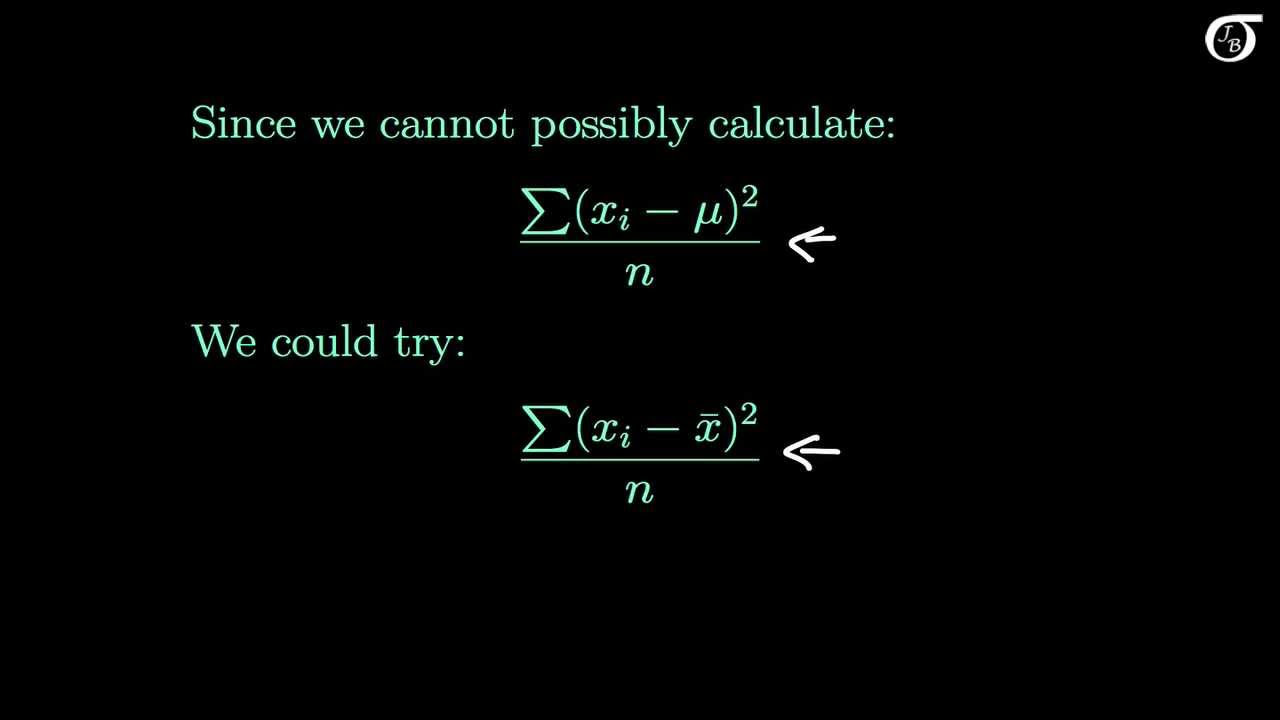
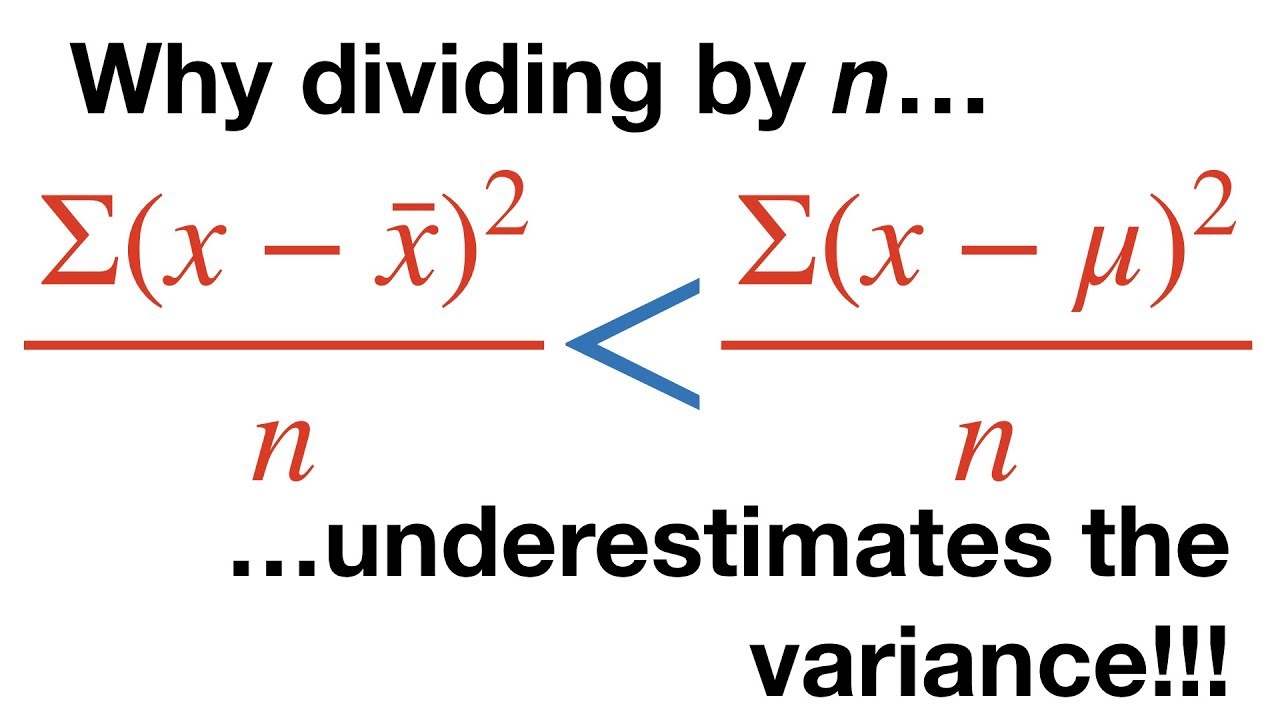
- 🎯 Underestimation Issue: Using X bar leads to an underestimation of the sum of squared deviations because scores closer to X bar than mu will have smaller deviations, and those farther from X bar will have larger deviations.
- 🏆 X bar's Position: The position of X bar relative to mu determines whether the deviations are underestimated or overestimated. More scores below X bar result in more underestimates, while more scores above result in more overestimates.
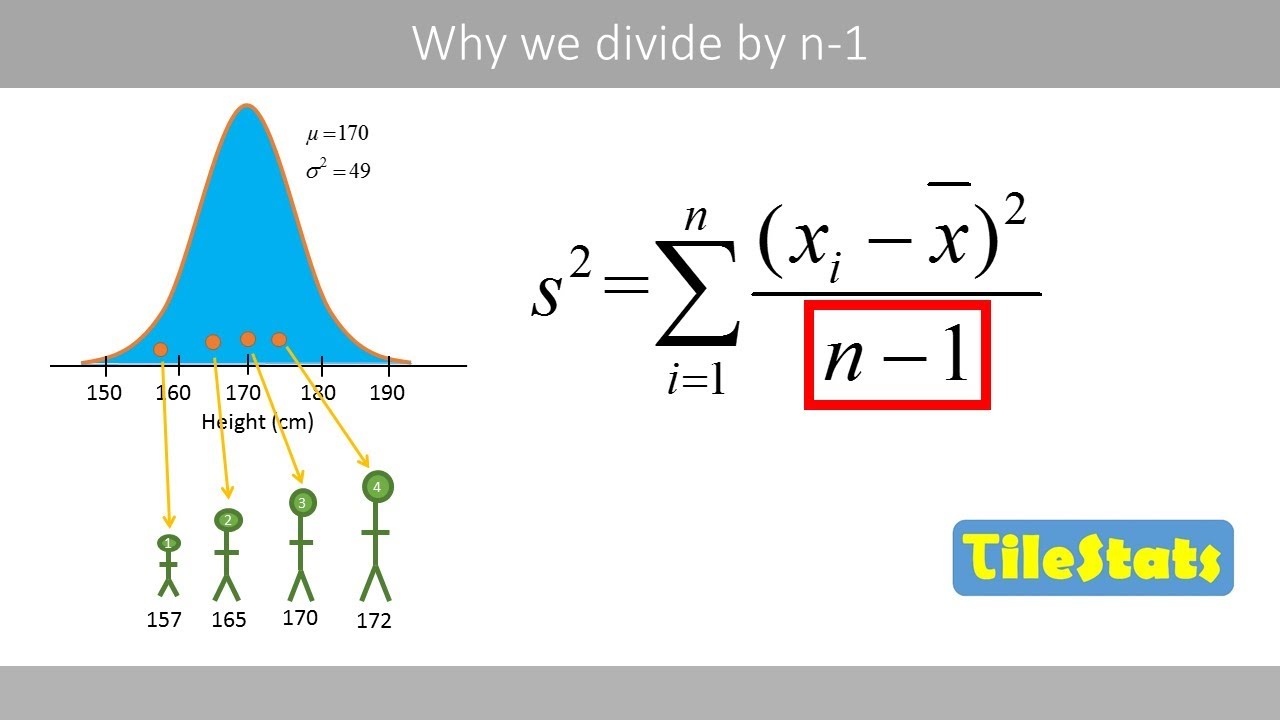
- 📈 Sample Distribution: The distribution of sample scores around X bar and mu helps to understand the degree of underestimation or overestimation of deviations.
- 🔢 Degrees of Freedom: The concept of degrees of freedom (n-1) relates to the number of values in a sample that are free to vary once the X bar is known; the last score is determined by the requirement to reach the X bar.
- 🌐 Sample Size Impact: As sample size increases, X bar becomes a better approximation of mu, reducing the underestimation of deviations and the impact of using n-1 in the calculation.
- 🎓 Bias Adjustment: The bias in the sample variance, represented as Sigma squared divided by n, decreases as sample size increases, justifying the use of n-1 as an adjustment for this bias.
- 📝 Mathematical Representation: The biased sample variance can be expressed as the population variance minus the bias (Sigma squared over n), leading to the formula for the unbiased estimate of variance.
- 🚫 Rare Exceptions: Although the n-1 adjustment is generally appropriate, there are rare cases where it could lead to an overestimation of variance if X bar happens to equal mu in a small sample.
- 💡 General Safety: Given that we usually do not know mu and the small chance of X bar equaling mu, it is safer to assume some bias and use n-1 for adjustment in most cases.
Q & A
Why do we tend to divide by n minus 1 instead of n when estimating variance?
-Dividing by n minus 1 is known as Bessel's Correction, which helps to adjust for the bias in estimating the population variance from a sample. This adjustment accounts for the fact that using the sample mean (X bar) instead of the population mean (mu) introduces an underestimate in the sum of squared deviations.
What is Bessel's Correction and why is it important?
-Bessel's Correction is a statistical adjustment that involves dividing the sum of squared deviations by n minus 1 rather than n when estimating population variance from a sample. It is important because it helps to correct the underestimation of variance that occurs when using the sample mean instead of the true population mean.
How does using X bar instead of mu lead to an underestimation of the sum of squared deviations?
-Using X bar instead of mu leads to an underestimation because the sample mean (X bar) is not always equal to the population mean (mu). When X bar is different from mu, it causes more of the sample scores to be closer to X bar than to mu, resulting in an underestimate of the deviations from mu.
What is the concept of degrees of freedom in the context of Bessel's Correction?
-In the context of Bessel's Correction, degrees of freedom refer to the number of independent values in a sample that can vary freely. When we know the sample mean (X bar), one degree of freedom is 'used up' to achieve this mean, leaving n minus 1 degrees of freedom. Therefore, we divide by n minus 1 instead of n to account for this loss of one degree of freedom.
How does the sample size affect the degree of underestimation in the sum of squared deviations?
-As the sample size increases, the sample mean (X bar) becomes a better estimate of the population mean (mu), reducing the degree of underestimation. With a larger sample size, the difference between dividing by n and n minus 1 becomes smaller, leading to a smaller adjustment and a more accurate estimate of the population variance.
What is the mathematical representation for the bias in the sample variance?
-The mathematical representation for the bias in the sample variance is Sigma squared divided by n, where Sigma squared is the population variance and n is the sample size. This shows that the bias decreases as the sample size increases.
How does the formula for the unbiased estimate of population variance using n minus 1 derive from the concept of bias?
-The formula derives from the equation that the biased sample variance (Sigma (x - X bar) squared / n) equals the population variance (Sigma squared) minus the bias (Sigma squared / n). By solving for the biased sample variance and dividing by (1 - 1/n), we get the unbiased estimate of the population variance as Sigma (x - X bar) squared / (n - 1).
What happens when X bar equals mu in a sample?
-When X bar equals mu, there is no underestimation of the sum of squared deviations, and the sample variance accurately estimates the population variance. However, this situation is rare and usually not known, so it is safer to assume that there is an underestimate and use n minus 1 for adjustment.
Why do we not know if X bar equals mu in a sample?
-We do not know if X bar equals mu because we typically do not know the true population mean (mu). Even if by chance X bar equals mu in a particular sample, we would not be able to confirm this without knowing the population mean.
What is the potential issue with using n minus 1 adjustment in cases where X bar happens to equal mu?
-In cases where X bar equals mu, using the n minus 1 adjustment would overcorrect the estimate, leading to an overestimation of the population variance. However, since we usually cannot confirm this situation due to the unknown population mean, it is still recommended to use n minus 1 for the adjustment.
What is the significance of the video's focus on conceptual understanding over made-up examples?
-The focus on conceptual understanding aims to provide a deeper insight into why n minus 1 is used as an adjustment, allowing for better application of the concept to any data set, rather than relying on specific examples that may not generalize well.
How can the concepts in this video be applied to real-world data sets?
-By understanding the logic behind Bessel's Correction and the reasons for underestimation, one can more accurately estimate population variance from sample data. This knowledge helps in making appropriate statistical adjustments and interpreting results correctly in various fields of study.
Outlines
📘 Introduction to Bessel's Correction
The video begins with an introduction to Bessel's Correction, a statistical concept that explains why variance is often estimated using n minus 1 instead of n. The speaker, Michael Corayer, emphasizes the importance of understanding the underlying logic of this method rather than relying on rote application. He aims to explain the concept conceptually, focusing on why using the sample mean (X bar) instead of the population mean (mu) tends to result in an underestimate of the sum of squared deviations, which is the root of the problem addressed by Bessel's Correction.
📊 Degrees of Freedom and Sample Composition
In the second paragraph, the concept of degrees of freedom is introduced, explaining its relevance to the composition of a sample and the impact on estimating variance. The speaker illustrates how knowing the sample mean (X bar) reduces the number of freely varying values in the sample, hence the term 'degrees of freedom' is used to describe the values that can vary independently. The explanation includes a practical example where a fixed X bar necessitates a specific value in the sample, thus reducing the degrees of freedom by one. This understanding leads to the rationale behind dividing by n minus 1 when calculating variance, as it accounts for the non-varying nature of the last value in the sample.
🔢 Bias Estimation and Adjustment
The final paragraph delves into the mathematical representation of bias in estimating variance and how it can be adjusted. The speaker explains that the biased sample variance is equal to the population variance minus the bias, which is dependent on the sample size. A formula is derived to express the bias as the population variance divided by the sample size (n). The paragraph clarifies that as the sample size increases, the bias decreases, and the estimate becomes closer to the actual population variance. The speaker concludes by reinforcing that dividing by n minus 1 is the appropriate adjustment to account for the average bias in variance estimation, despite exceptions in rare cases where the sample mean might equal the population mean.
Mindmap
Keywords
💡Bessel's Correction
💡Variance
💡Sample Mean (X bar)
💡Population Mean (mu)
💡Degrees of Freedom
💡Bias
💡Sum of Squared Deviations
💡Sample Size
💡Population Variance
💡Unbiased Estimator
💡Statistical Adjustment
Highlights
The video explains the rationale behind using n minus 1 instead of n when estimating variance, known as Bessel's Correction.
The use of n minus 1 is aimed at providing a better estimate than using n on average, and the video focuses on explaining this concept rather than using made-up examples.
Using X bar (sample mean) instead of mu (population mean) tends to underestimate the sum of squared deviations, which is the root cause of the need for Bessel's Correction.
The video discusses how the position of X bar relative to mu affects the estimation of deviations, with examples illustrating the underestimation issue.
The concept of degrees of freedom is introduced to explain why n minus 1 is used, relating to the number of values in a sample that are free to vary.
The video clarifies that knowing X bar means that not all sample values are free to vary, hence the use of n minus 1 in calculations.
The impact of sample size on the underestimation of deviations is discussed, with larger sample sizes leading to smaller underestimates.
The video presents a mathematical representation of bias in sample variance based on sample size, showing how bias decreases as sample size increases.
An algebraic approach is used to demonstrate that dividing by n minus 1 adjusts for the bias in estimating population variance from sample data.
The video acknowledges that using n minus 1 does not always work perfectly and may lead to overestimation in rare cases.
The concept of bias as Sigma squared divided by n is introduced, representing how much the sample variance is likely to underestimate the population variance.
The video emphasizes that the adjustment using n minus 1 is generally safe and accurate, despite potential overestimation in very few cases.
The video concludes by reinforcing the conceptual understanding of why n minus 1 is the appropriate adjustment for variance estimation.
The presenter invites viewers to share their thoughts and ask questions, encouraging interaction and further learning.
The video is part of a series of psychology tutorials, offering a wealth of resources for those interested in the subject.
The video provides a comprehensive and clear explanation of a statistical concept, making it accessible to a wide audience.
Transcripts
Browse More Related Video
Why We Divide by N-1 in the Sample Variance (Standard Deviation) Formula | The Bessel's Correction
The Sample Variance: Why Divide by n-1?
Why do we divide by n-1 and not n? | shown with a simple example | variance and sd
Why Dividing By N Underestimates the Variance
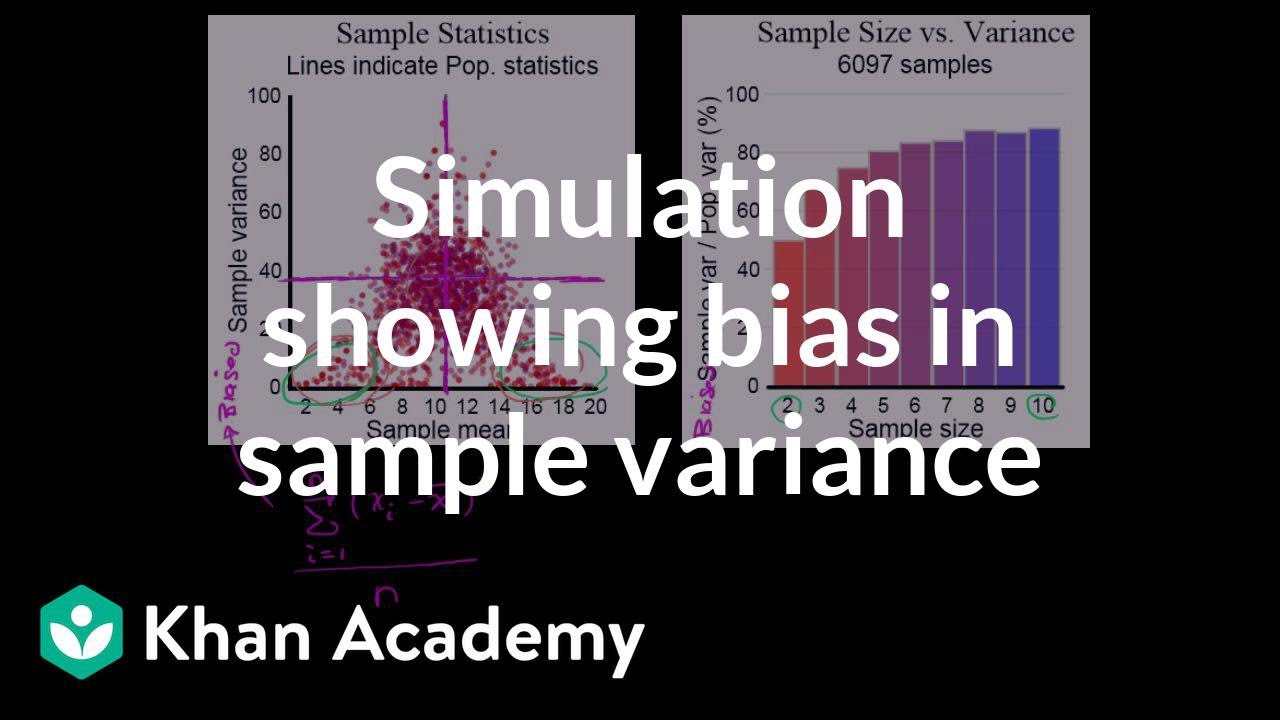
Simulation showing bias in sample variance | Probability and Statistics | Khan Academy

Sample variance | Descriptive statistics | Probability and Statistics | Khan Academy
5.0 / 5 (0 votes)
Thanks for rating: