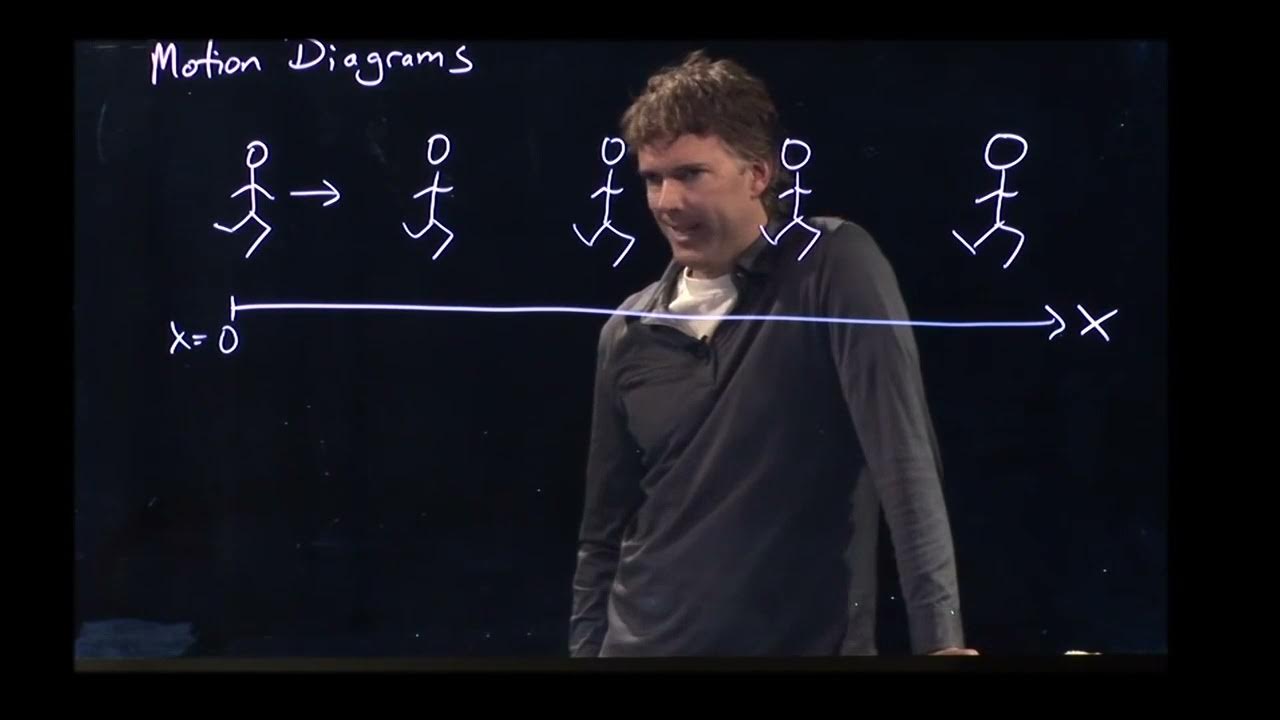
Motion diagrams
TLDRThe script explains the concept of motion diagrams, a tool used to model an object's movement by capturing its position at regular time intervals with 'flashes' of information. It describes how equally spaced dots indicate constant velocity, and the use of arrows to represent velocity and acceleration. The script illustrates scenarios of constant velocity, acceleration (speeding up and slowing down), and changing direction, emphasizing that while motion diagrams are a valuable way to visualize movement, they are just one of many models used in physics.
Takeaways
- 📈 Motion diagrams are a visual tool to model object motion, similar to images captured by a strobe light at regular intervals.
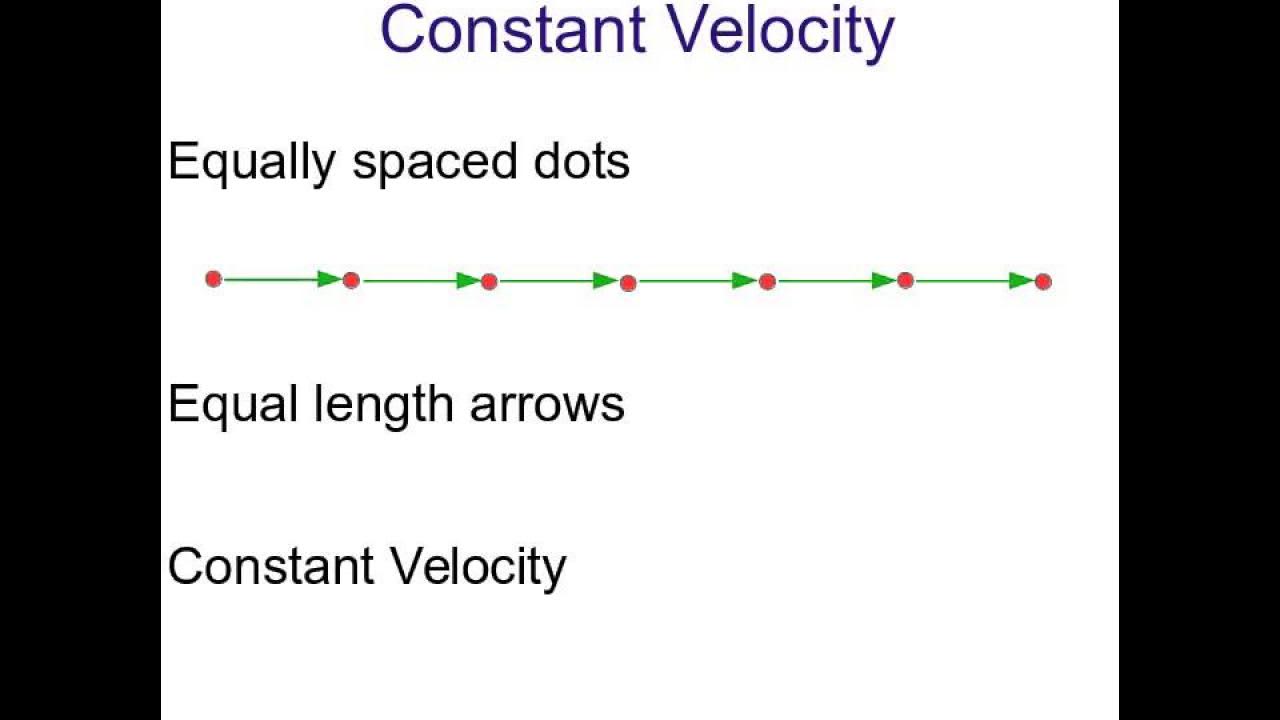
- 🏃 Constant velocity is depicted by equally spaced dots and arrows of the same size throughout the diagram.
- 🔄 Zero acceleration is represented by the absence of change in velocity and acceleration vectors pointing in the same direction as velocity.
- 🚀 Accelerating objects show non-equal spacing between dots, with smaller distances covered at the beginning and larger distances as speed increases.
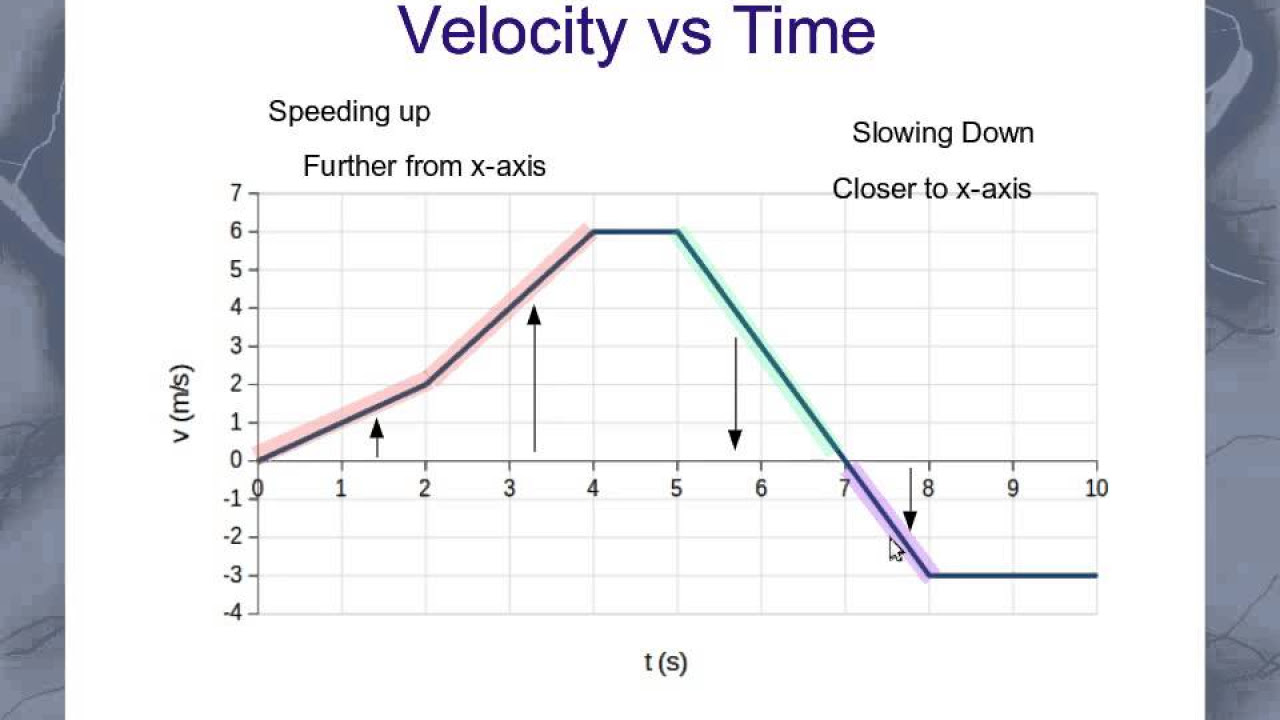
- 🌟 Velocity arrows for an accelerating object start small and grow larger over time, indicating increasing speed.
- 🧭 Acceleration is indicated by arrows showing direction, not magnitude, with the rule that if an object speeds up, acceleration and velocity are in the same direction.
- 🔄 When an object changes direction, velocity and acceleration arrows reflect the new direction of motion.
- 🎾 An example of changing direction is a ball thrown upward, which slows down due to gravity, stops momentarily at its peak, then speeds up as it falls back down.
- 🔄 In the case of a ball thrown upward, gravity provides a constant downward acceleration, while the velocity changes from upward to downward.
- 📊 Motion diagrams are a valuable method for modeling motion, but they are just one of many approaches to understanding and describing motion.
Q & A
What is a motion diagram?
-A motion diagram is a visual representation of an object's motion, created like images taken by a strobe light at regular intervals to show the object's position at different moments in time.
How do the spacings between the dots in a motion diagram indicate the object's speed?
-Equal spacings between the dots suggest that the object is moving at a constant speed, while unequal spacings indicate a change in speed.
What do arrows in a motion diagram represent?
-Arrows in a motion diagram represent both velocity and acceleration, showing the direction and magnitude of these physical quantities.
How does a motion diagram show an object traveling at constant velocity?
-For an object traveling at constant velocity, the motion diagram will show equally spaced dots and velocity arrows of the same size throughout the sequence.
What is the significance of the changing size of velocity arrows in a motion diagram?
-Changing size of velocity arrows indicates that the object's speed is changing; larger arrows represent greater speed, while smaller arrows represent lesser speed.
How can you depict acceleration in a motion diagram?
-Acceleration is depicted by arrows that indicate the direction of the acceleration. The size of these arrows is not typically used to represent the magnitude of acceleration in basic motion diagrams.
What happens to the motion diagram when an object speeds up from rest?
-When an object speeds up from rest, the motion diagram shows smaller distances covered in the initial time intervals and larger distances as time progresses, with velocity arrows increasing in size.
What is the relationship between velocity and acceleration when an object is speeding up?
-When an object is speeding up, its velocity and acceleration vectors have components in the same direction.
How does a motion diagram illustrate an object changing direction?
-A motion diagram illustrates an object changing direction by showing the positions of the object at different times, with arrows indicating the change in velocity direction as the object slows down and then speeds up in the opposite direction.
Can motion diagrams be used for both one-dimensional and two-dimensional motion?
-Yes, motion diagrams can represent both one-dimensional and two-dimensional motion, though the latter may be more complex due to the involvement of multiple directions.
How can motion diagrams be converted to other descriptions or models of motion?
-Motion diagrams can be interpreted and translated into other forms of motion descriptions or models, such as mathematical equations or narrative explanations, through the analysis of the positions, velocities, and accelerations depicted.
Outlines
📊 Understanding Motion Diagrams and Constant Velocity
This paragraph introduces the concept of motion diagrams as a tool to model the motion of an object. It likens the diagrams to images captured by a strobe light, showing the object's position at regular time intervals. The paragraph explains how the equal spacing between the dots indicates constant velocity, represented by arrows of the same size throughout the diagram. Additionally, it clarifies that in this scenario, acceleration is zero, as velocity remains constant, and uses dots to denote this absence of acceleration.
🚀 Analyzing Acceleration with Motion Diagrams
The second paragraph delves into more complex motion scenarios, such as an object speeding up from rest. It describes how the position dots in a motion diagram change to reflect the varying distances covered in equal time intervals as the object accelerates. The paragraph illustrates this with velocity arrows that increase in size from left to right, indicating the object's increasing speed. It also touches on the concept of acceleration, explaining that for an object speeding up, velocity and acceleration are in the same direction, though it notes that the magnitude of acceleration is not detailed in the diagram due to its complexity.
Mindmap
Keywords
💡motion diagrams
💡velocity
💡acceleration
💡constant velocity
💡strobe light
💡position
💡arrows
💡deceleration
💡direction
💡time intervals
💡two-dimensional motion
Highlights
Modeling motion through motion diagrams, akin to images captured by a strobe light.
Regular intervals of light flashes to track an object's position at different moments in time.
Use of arrows to represent velocity, indicating both direction and magnitude.
Equal spacing between dots signifies constant velocity.
Constant velocity is depicted by arrows of the same size throughout the diagram.
Zero acceleration is shown by dots instead of arrows at the bottom of the diagram.
For an object speeding up, the distances covered in equal time intervals increase.
Velocity arrows start small and grow larger over time for an accelerating object.
Acceleration is indicated by the direction of the arrows, not their size in these diagrams.
Acceleration and velocity are in the same direction for an object speeding up.
In one-dimensional motion, if an object slows down, velocity and acceleration are in opposite directions.
An object can change direction while maintaining the same acceleration, as in the case of a ball thrown upward.
Gravity provides a constant downward acceleration, affecting both upward and downward motion of a thrown ball.
Motion diagrams are a valuable tool for modeling motion, but they are just one of many methods.
Developing the skill to translate between motion diagrams and other models is essential.
Motion diagrams can be converted into narrative descriptions and vice versa.
Transcripts


5.0 / 5 (0 votes)
Thanks for rating: