Interpreting Velocity graphs
TLDRThe video script offers a comprehensive guide to interpreting velocity graphs, highlighting the significance of positive and negative velocities, constant velocity, and acceleration. It explains how the position relative to the x-axis indicates forward or backward motion, while horizontal segments denote constant velocity with no acceleration. The script further clarifies the concepts of speeding up and slowing down through the distance from the x-axis and distinguishes between constant and variable acceleration. The example of a velocity curve illustrates the dynamic changes in motion, including direction changes and the transition from rest to motion, emphasizing the nuanced relationship between acceleration and speed.
Takeaways
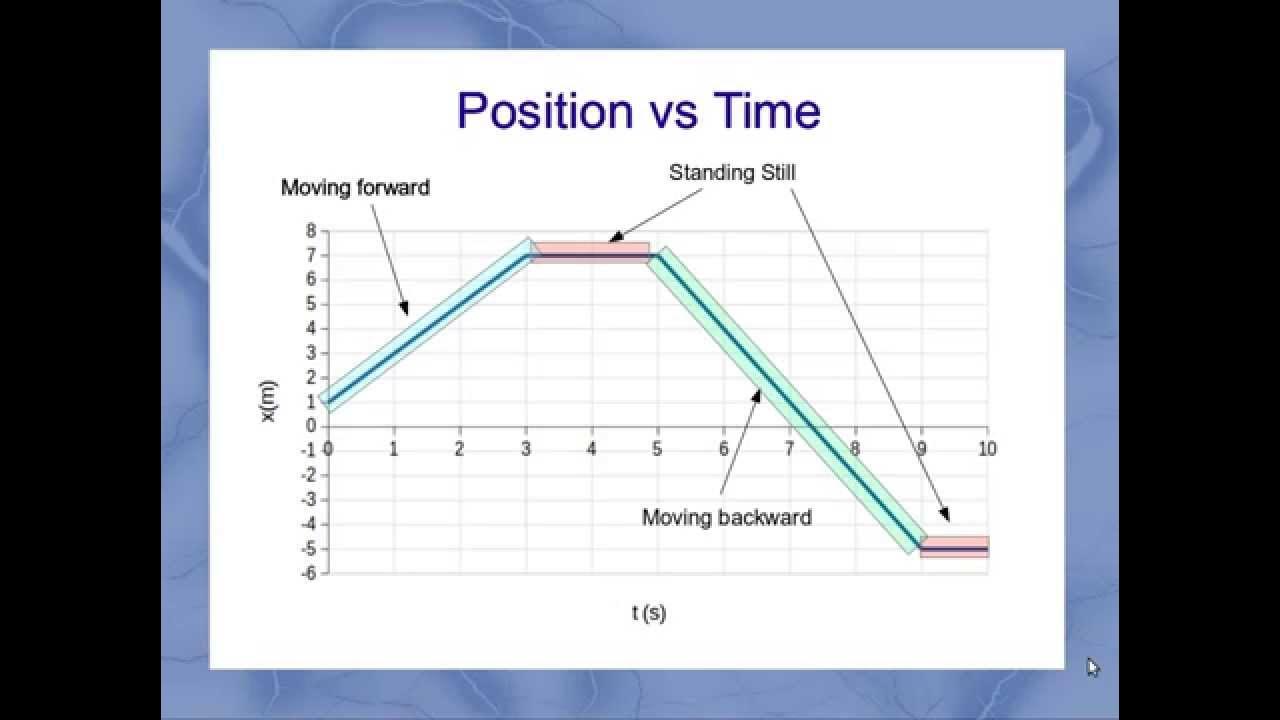
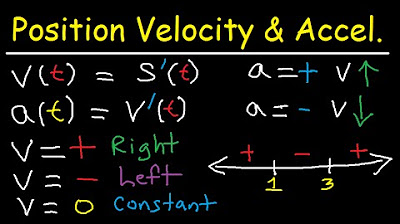
- 📈 Positive velocities indicate forward movement, while negative velocities signify backward motion.
- 📉 Anything above the x-axis represents continuous forward motion, and below it indicates continuous backward motion.
- 🚫 Being on the x-axis means there is no movement occurring at that point in time.
- 🔄 Horizontal flat segments on the velocity graph represent constant velocity, which also means no acceleration is present.
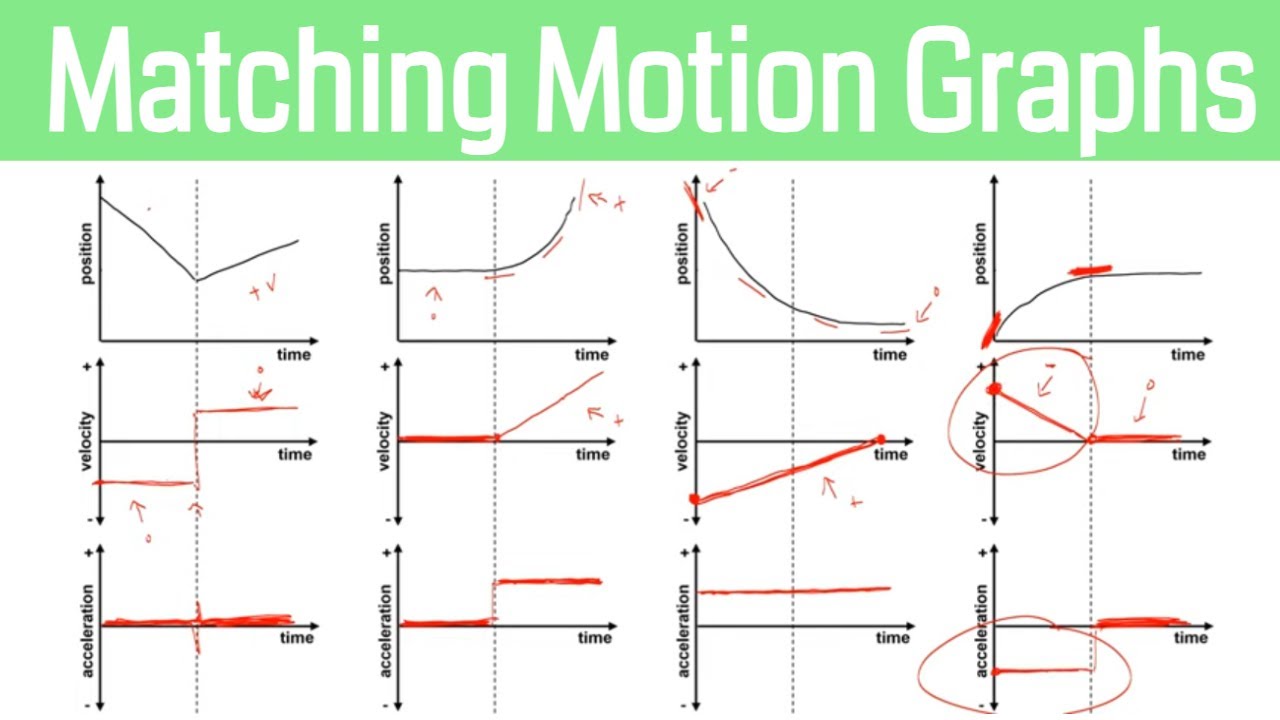
- 🔺 An upward slope on the graph indicates positive acceleration, and a flat line indicates constant acceleration over that segment.
- 🔻 A downward slope represents negative acceleration, with the steepness indicating the magnitude of the acceleration.
- 🌟 Moving further from the x-axis during positive acceleration means speeding up, while moving closer to the x-axis indicates slowing down.
- 🔄 Even with negative acceleration, you can speed up if you're moving further from the x-axis, such as when moving backward faster.
- 🛑 A segment with negative acceleration can also mean slowing down, as seen when the velocity moves closer to the x-axis.
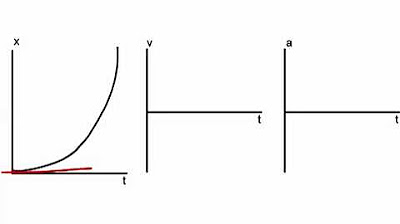
- 🔍 Curved velocity graphs can still be analyzed by considering the steepness of the curve to determine changes in speed and direction.
- 🔄 At points of rest, a change in direction occurs, which can be followed by speeding up in the new direction of motion.
Q & A
What does positive velocity indicate?
-Positive velocity indicates that an object is moving forward.
What does negative velocity signify in the context of the graph?
-Negative velocity signifies that an object is moving backward.
When an object is on the x-axis in the velocity graph, what does this represent?
-When an object is on the x-axis, it means that the object is not moving.
What does a horizontal flat segment on the velocity vs. time graph represent?
-A horizontal flat segment indicates constant velocity, which also means there is no acceleration.
How can you identify positive acceleration on the graph?
-Positive acceleration is represented by an upward slope on the velocity vs. time graph.
What does a downward slope on the velocity graph indicate?
-A downward slope indicates negative acceleration, meaning the acceleration is in the opposite direction of the positive velocity.
How can you tell if you're speeding up based on the velocity graph?
-You're speeding up if you're moving further away from the x-axis on the graph.
What does it mean to slow down on the velocity graph?
-You're slowing down if you're moving closer to the x-axis on the graph.
How can a curved segment on the velocity graph be interpreted?
-A curved segment indicates a change in acceleration, and it can represent both speeding up and slowing down depending on the direction of the curve.
What happens when the velocity graph crosses the x-axis?
-When the velocity graph crosses the x-axis, it signifies a change in direction from moving forward to backward or vice versa.
How does the distance from the x-axis relate to the speed of an object?
-The further an object's velocity is from the x-axis, the faster it is moving. Conversely, the closer to the x-axis, the slower it is moving.
Outlines
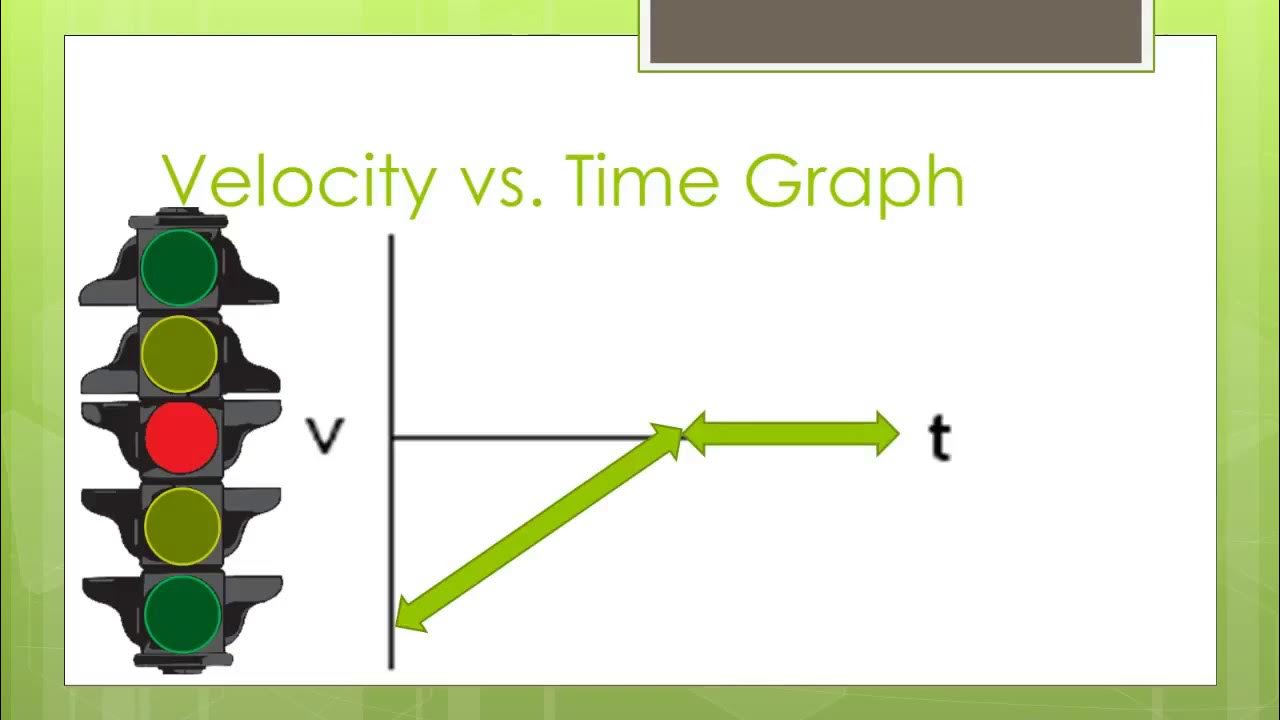
📊 Understanding Velocity Graphs
This paragraph introduces the interpretation of velocity graphs, emphasizing the significance of positive and negative velocities. Positive velocities indicate forward movement, while negative velocities signify backward motion. The script explains that being on the x-axis equates to no movement, as seen at the start and at seven seconds. It further discusses the concepts of constant velocity, represented by horizontal flat segments, and acceleration, indicated by the slope of the graph. Positive acceleration is associated with upward slopes, and negative acceleration with downward slopes. The paragraph also clarifies the difference between acceleration and the rate of speed change, noting that moving further from the x-axis signifies speeding up, while approaching the x-axis indicates slowing down. The explanation includes the analysis of curved velocity paths and the transition from rest to motion, including changing direction.
🚀 Key Concepts in Velocity Graph Interpretation
The second paragraph summarizes the key concepts for interpreting velocity graphs. It reiterates that upward slopes represent positive acceleration and downward slopes indicate negative acceleration. The distance from the x-axis is used to determine if the object is speeding up or slowing down, with increasing distance signifying acceleration and decreasing distance indicating deceleration. The paragraph provides a succinct overview of the visual cues to look for when analyzing velocity versus time graphs, reinforcing the understanding of velocity, acceleration, and the direction of movement.
Mindmap
Keywords
💡Velocity
💡Acceleration
💡X-axis
💡Positive Velocity
💡Negative Velocity
💡Constant Velocity
💡Direction of Motion
💡Speeding Up
💡Slowing Down
💡Curved Velocity
💡Change of Direction
Highlights
Positive velocities indicate forward movement, while negative velocities signify backward movement.
Any position above the x-axis represents forward movement, and below the x-axis represents backward movement.
Being on the x-axis means there is no movement occurring.
Horizontal flat segments on the velocity graph indicate constant velocity and thus no acceleration.
An upward slope on the graph signifies positive acceleration.
A flat line on the graph indicates a constant value of acceleration over that segment.
A steeper upward slope indicates a higher positive acceleration.
A downward slope represents negative acceleration, with the steepest slope indicating a large negative acceleration.
Moving further away from the x-axis during positive acceleration means speeding up.
Approaching the x-axis indicates slowing down for the respective segment.
Even with negative acceleration, one can speed up if moving further from the x-axis, as in the case of speeding up while moving backward.
A curved velocity graph can still be interpreted in terms of the steepness of the curve to understand acceleration.
Coming to rest and then changing direction is represented by passing through the x-axis without stopping.
The velocity curve can be analyzed to determine direction, speeding up or slowing down, and changes in direction.
Positive and negative values on the graph tell you the direction of movement, forward or backward.
Speeding up is represented by moving further from the x-axis, while slowing down is indicated by moving closer to the axis.
This overview provides essential insights for interpreting velocity graphs effectively.
Transcripts
Browse More Related Video
5.0 / 5 (0 votes)
Thanks for rating: