Distance (position) to Velocity Time Graph Physics Help
TLDRThe script discusses the interpretation of position-time (DT) and velocity-time (VT) graphs in physics. It explains how the slope of a DT graph represents velocity and the slope of a VT graph represents acceleration. The video analyzes a complex DT graph, breaking it into distinct regions based on changes in slope, and then constructs the corresponding VT graph. The analysis reveals the object's motion, including uniform motion, sudden stops, acceleration, and deceleration. The script also touches on the importance of understanding these graphs for solving physics problems and the relationship between the area under the curves and the object's displacement.
Takeaways
- 📈 The slope of a displacement-time (DT) graph represents velocity, while the slope of a velocity-time (VT) graph represents acceleration.
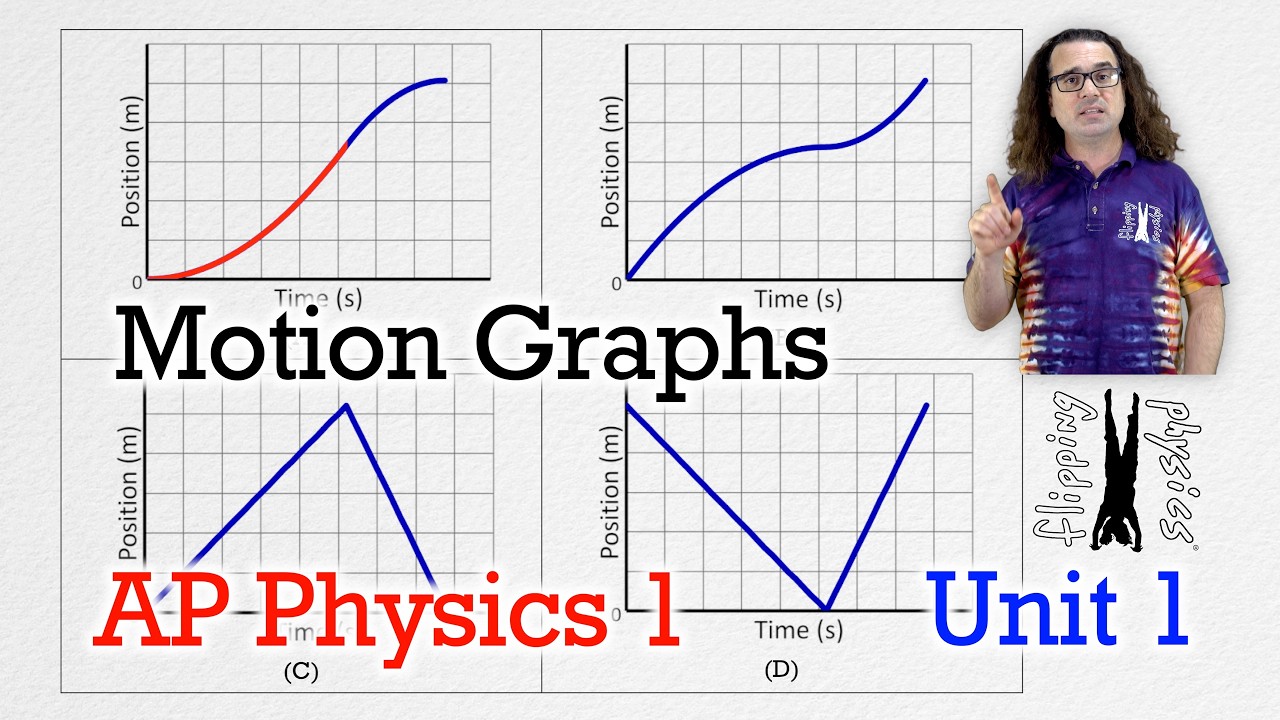
- 🚀 A curved DT graph indicates changing velocity, which translates to a varying acceleration in the VT graph.
- 🔄 The script discusses identifying distinct regions in a DT graph by observing changes in slope and curvature.
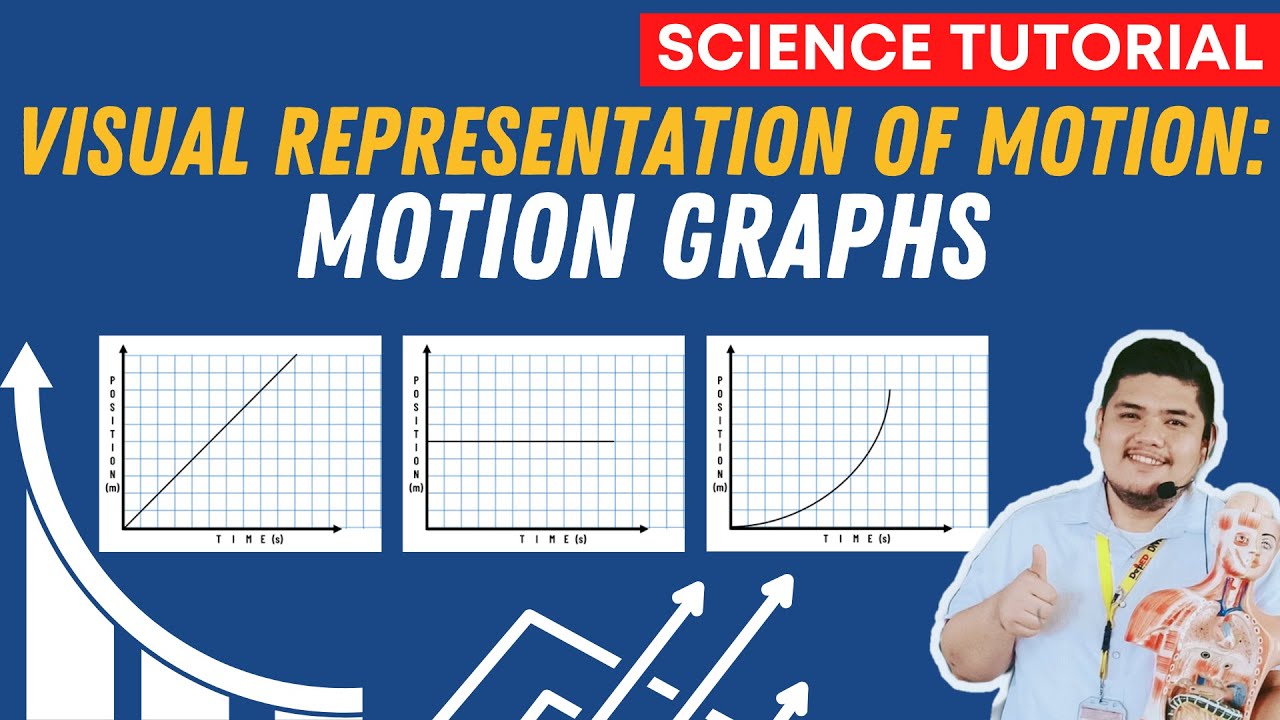
- 📊 In the first section of the DT graph, a straight line indicates uniform motion with constant velocity.
- 🏁 A horizontal line in the VT graph corresponds to a velocity of zero, suggesting an instantaneous stop in motion.
- 📈 A diagonal line in the VT graph with a positive slope indicates an increase in velocity over time.
- 📉 A diagonal line in the VT graph with a negative slope signifies deceleration or acceleration in the opposite direction.
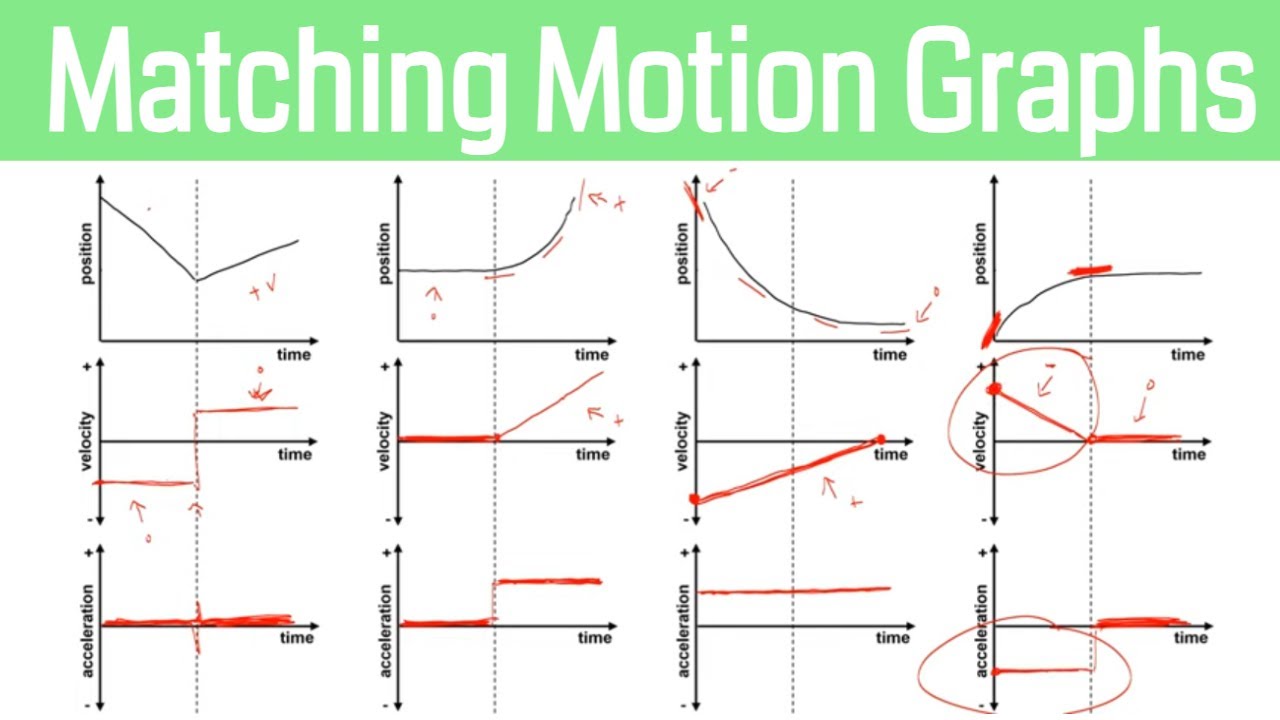
- 🔄 The velocity-time graph can be used to infer the motion described by the displacement-time graph, providing a detailed account of the object's movement.
- 🔄 The area under the velocity-time graph represents the displacement, which should sum up to zero if the object returns to its starting point.
- 📊 The acceleration-time (AT) graph provides information about the direction and magnitude of acceleration during different intervals of time.
- 🎥 The video script serves as a tutorial on interpreting and analyzing motion through DT, VT, and AT graphs, emphasizing the importance of understanding changes in slope and the physical implications of these changes.
Q & A
What does the slope of a DT (displacement-time) graph represent?
-The slope of a DT graph represents velocity. A straight DT graph indicates uniform motion, meaning constant velocity.
How does one determine acceleration from a velocity-time (VT) graph?
-Acceleration is determined by taking the slope of the VT graph. The change in slope indicates changes in acceleration.
What is the significance of a horizontal line in a VT graph?
-A horizontal line in a VT graph signifies that the velocity is constant and not changing over time.
What does a curved line in a DT graph indicate?
-A curved line in a DT graph indicates that the object's velocity is changing, which means there is acceleration or deceleration involved.
How can one identify different motion regions on a DT graph?
-Different motion regions on a DT graph can be identified by observing changes in the graph's slope, such as transitions from horizontal to curved or straight lines.
What is the relationship between the slope of a curve on a DT graph and the resulting line on an acceleration-time (AT) graph?
-The slope of a curve on a DT graph will result in a diagonal line on an AT graph. The direction and steepness of the diagonal line represent the nature of the acceleration or deceleration.
How does the total area under a velocity-time graph relate to displacement?
-The total area under a VT graph represents the net displacement of the object. If the areas above and below the horizontal axis (representing positive and negative velocities) are equal, the net displacement is zero.
What is the significance of a zero slope in an AT graph?
-A zero slope in an AT graph indicates that there is no acceleration; the object is either at rest or moving with constant velocity.
How does a velocity-time graph differ from an acceleration-time graph in terms of the information provided?
-A VT graph provides information about the speed and direction of an object over time, while an AT graph provides information about the rate of change of velocity (acceleration). The VT graph gives more context about the motion, including both speed and changes in speed, whereas the AT graph focuses solely on acceleration patterns.
What is the implication of a negative slope in an AT graph?
-A negative slope in an AT graph indicates that the object is experiencing deceleration or a decrease in velocity over the time period represented by that section of the graph.
How can one use the information from a DT graph to predict the motion of an object?
-By analyzing the slope and curvature of a DT graph, one can predict whether the object is moving at a constant speed, accelerating, decelerating, or changing direction. Straight lines indicate uniform motion, while curves indicate changing velocity.
Outlines
📈 Understanding Velocity and Acceleration from Graphs
This paragraph discusses the relationship between different types of graphs and the physical quantities they represent. It explains that the slope of a displacement-time (DT) graph represents velocity, and the slope of a velocity-time (VT) graph represents acceleration. The speaker uses a big position-time graph to illustrate how to identify different regions of motion by examining the slopes of the graph. The explanation includes how to interpret a curved DT graph, the significance of horizontal and diagonal lines in the context of velocity and acceleration, and the implications of zero slope in both DT and VT graphs.
📊 Analyzing a Velocity-Time Graph and Its Implications
The second paragraph delves into the analysis of a velocity-time graph derived from the displacement-time graph discussed earlier. It describes how to interpret the graph by connecting the different sections with lines and understanding the physical meaning behind the slopes. The speaker points out the unrealistic nature of a sudden velocity drop to zero and suggests a more plausible scenario involving negative acceleration. The paragraph also discusses the relationship between the areas under the velocity-time graph and the total displacement, emphasizing that the object's total displacement is zero. Furthermore, it compares the information provided by the acceleration-time graph with that of the velocity-time graph, highlighting the additional details provided by the latter.
Mindmap
Keywords
💡slope
💡displacement-time graph (DT graph)
💡velocity
💡acceleration
💡uniform motion
💡curvature
💡area under the graph
💡negative acceleration
💡motion description
💡acceleration-time graph (AC graph)
Highlights
Understanding the relationship between slope and velocity in graphs, where the slope of a displacement-time (DT) graph represents velocity.
The slope of a velocity-time (VT) graph represents acceleration, providing insight into changes in velocity over time.
If the DT graph is curved, taking the slope results in a different line, indicating a change in velocity over time.
A horizontal line in a DT graph corresponds to zero velocity, while a diagonal line indicates constant velocity.
Identifying distinct regions in a large position-time graph by observing changes in slope and curvature.
Breaking down a complex graph into sections based on changes in slope and curvature to better understand the motion.
In the first section of the graph, a straight DT line indicates uniform motion with constant velocity.
The second section shows a horizontal VT line, indicating a velocity of zero.
The third section reveals a positive slope in the VT graph, suggesting an increase in velocity.
The fourth section shows a decrease in slope to zero in the VT graph, indicating a deceleration to a stop.
The final section of the VT graph has a constant negative slope, representing uniform velocity in the opposite direction.
The velocity-time graph matches the displacement-time graph in describing the object's motion, confirming the accuracy of the analysis.
The area under the velocity-time graph corresponds to the displacement, which must be zero if the object returns to its starting point.
The acceleration-time graph provides less detailed information about the motion compared to the velocity-time graph.
The process of converting a velocity-time graph to a displacement-time graph is explored, with the next steps involving a practical application.
Transcripts
Browse More Related Video

Velocity Time Graphs, Acceleration & Position Time Graphs - Physics

High School Physics: Graphing Motion
Visualizing Motion Using Tape Charts and Motion Graphs | SCIENCE 7 QUARTER 3 MODULE 2 WEEK 3
Motion Graphs - AP Physics 1: Kinematics Review Supplement

Translating Motion Graphs: Position, Velocity, and Acceleration - IB Physics
How to Match Motion Graphs in Physics
5.0 / 5 (0 votes)
Thanks for rating: