Proof that the Sample Variance is an Unbiased Estimator of the Population Variance
TLDRThe video script presents a detailed mathematical proof demonstrating that the sample variance, denoted as s^2 and calculated using n-1 in the denominator, is an unbiased estimator of the population variance, Sigma^2. It explains the rationale behind using n-1 instead of n in the variance formula, leveraging concepts such as the expectation of a sum, the expectation of a constant times a random variable, and the variance of a random variable. The proof is methodical, utilizing the properties of expectation to show that the expectation of the sample variance equals the population variance, thus justifying the use of n-1 for an unbiased estimate.
Takeaways
- 📊 The script aims to prove that the sample variance (s^2) is an unbiased estimator of the population variance (Σ^2).
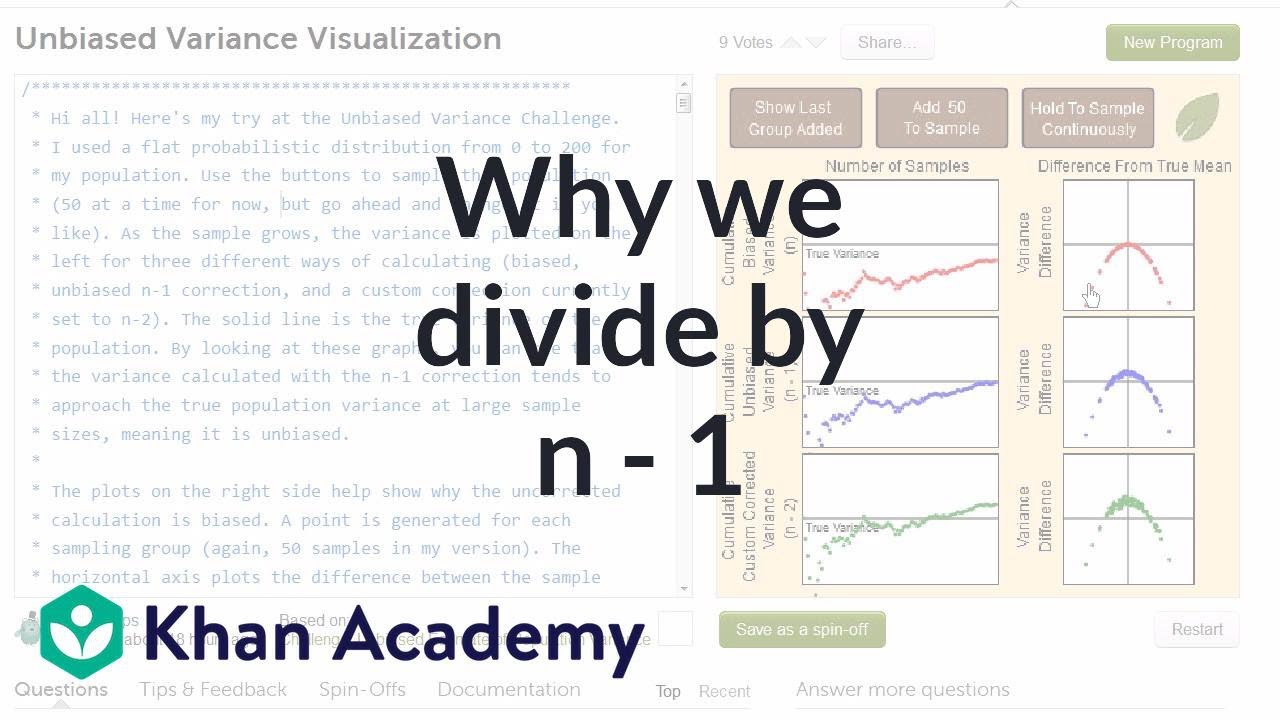
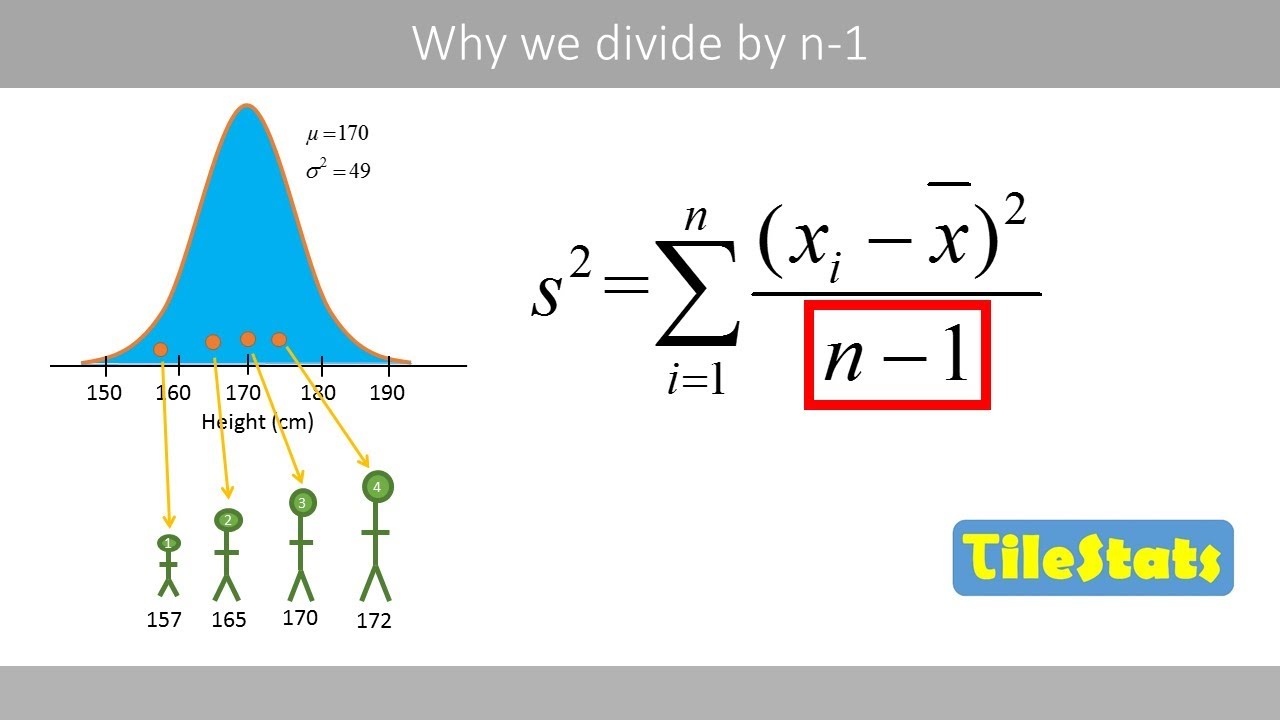
- 🔢 It explains the rationale behind using n-1 in the denominator instead of n in the sample variance formula.
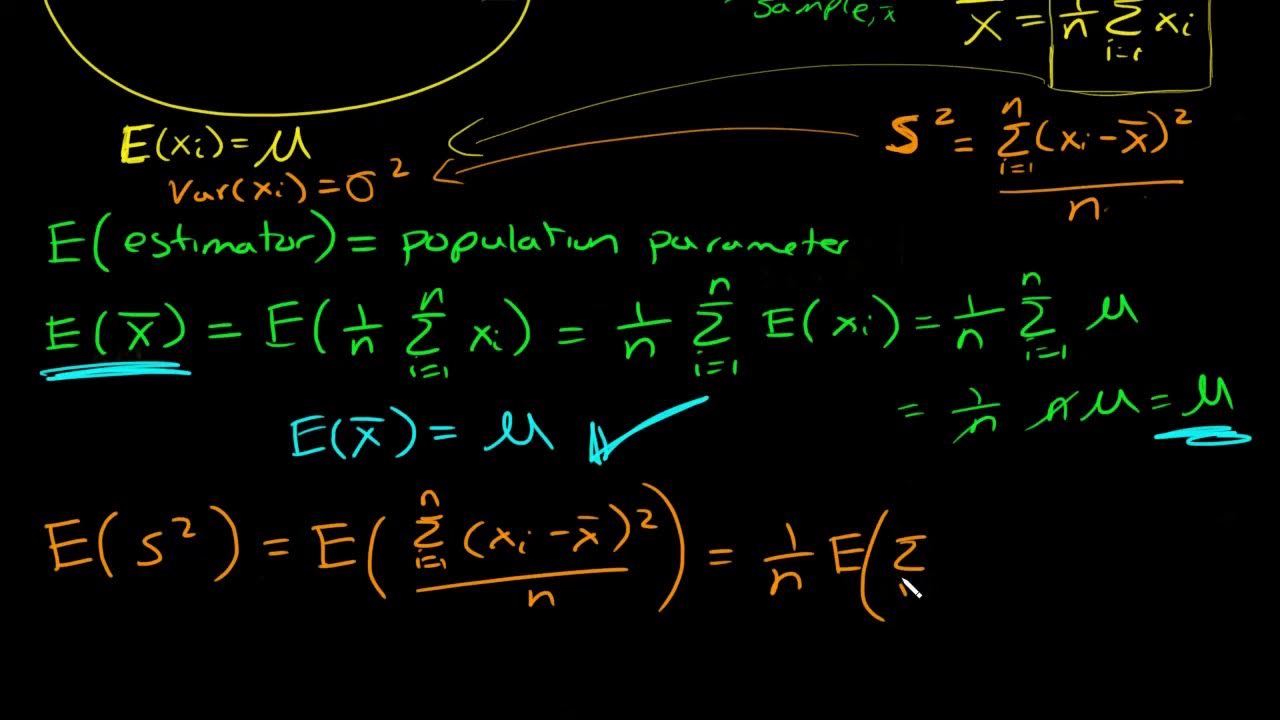
- 🎯 The proof involves independent observations (x1 through xn) from a population with mean (μ) and variance (Σ^2).
- 📚 Key statistical properties are used without proof, such as the expectation of a sum being the sum of expectations.
- 🔍 The variance of a random variable is defined as the expectation of its square minus the square of its expectation.
- 🧩 The proof breaks down the expectation of the sum of (Xi - X̄)^2, where X̄ is the sample mean.
- 🌟 The sum of (Xi - X̄)^2 is shown to be equivalent to the sum of Xi^2 minus 2 times Xi times X̄ plus n times (X̄)^2.
- 📈 The expectation of (Xi - X̄)^2 is derived, leading to the conclusion that E[(Xi - X̄)^2] = Σ^2 + μ^2 - 2μX̄.
- 🔧 The expectation of X̄^2 is calculated as (Σ^2/n) + μ^2, and the expectation of X̄ is μ.
- 📊 By substituting the expectations into the formula, the proof shows that E[s^2] = (n-1)Σ^2.
- 🚫 The script concludes that dividing by n would result in a biased estimator of the population variance, unlike dividing by n-1.
Q & A
What is the main topic of the video?
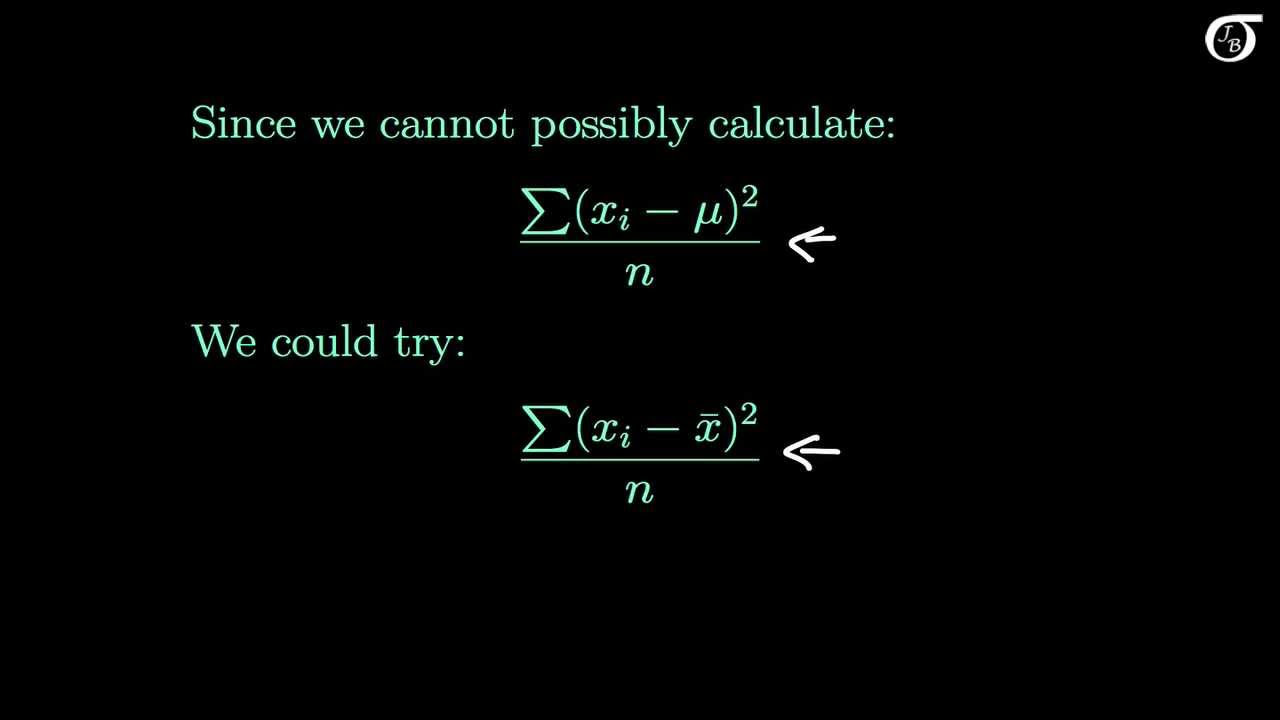
-The main topic of the video is to prove that the sample variance, denoted as s squared, is an unbiased estimator of the population variance, Sigma squared.
Why is it important to understand the difference between dividing by n and n-1 in the sample variance formula?
-Dividing by n-1 instead of n in the sample variance formula ensures that the estimator is unbiased. This is because when we calculate the sample variance, we are essentially trying to estimate the population variance based on a sample. Dividing by n-1 accounts for the degrees of freedom in the sample, leading to an unbiased estimate of the population variance.
What are the key properties of the independent observations x1 through xn?
-The independent observations x1 through xn are drawn from a population with a mean (mu) and variance (Sigma squared). The mean of each observation (X) is equal to mu, and the variance of each observation (X) is equal to Sigma squared.
What is the relationship between the variance of a random variable and the expectation of its square?
-The variance of a random variable is equal to the expectation of the square of the random variable minus the square of the expectation of the random variable.
What is the expected value of the sum of random variables?
-The expected value of the sum of random variables is the sum of the expected values of the individual random variables.
What is the expected value of the sample mean (x-bar) squared?
-The expected value of the sample mean (x-bar) squared is equal to the variance of the sample mean (which is Sigma squared over n) plus the square of the expected value of the sample mean (which is the population mean mu).
How does the proof demonstrate that the expectation of the sample variance s squared equals the population variance Sigma squared?
-The proof shows that the expectation of the sample variance s squared equals the population variance Sigma squared by first calculating the expectation of the numerator (the sum of (Xi - x-bar)^2) and then showing that when divided by n-1, the result is Sigma squared, thus confirming that s squared is an unbiased estimator of Sigma squared.
What would happen if we divided the sample variance by the sample size n instead of n-1?
-If we divided the sample variance by the sample size n instead of n-1, we would end up with a biased estimator of the population variance. This is because it would not properly account for the degrees of freedom, leading to an overestimation of the population variance.
What is the role of the constant n-1 in the sample variance formula?
-The constant n-1 in the sample variance formula, known as Bessel's correction, adjusts the denominator to provide an unbiased estimate of the population variance. It accounts for the loss of one degree of freedom due to the estimation of the population mean from the sample data.
How does the proof use the properties of expectations to show the unbiased nature of s squared?
-The proof utilizes properties of expectations, such as the linearity of expectation (expectation of a sum is the sum of expectations, and expectation of a constant times a random variable is the constant times the expectation of the variable) and the relationship between variance and expectation, to systematically show that the expectation of s squared equals Sigma squared when divided by n-1.
What is the significance of the result that the expectation of the sample variance s squared is equal to Sigma squared?
-The significance of this result is that it confirms the validity of the sample variance as an unbiased estimator of the population variance. This means that, on average, the sample variance will correctly estimate the population variance, which is crucial for statistical inference and hypothesis testing.
Outlines
📊 Introduction to Unbiased Estimation of Population Variance
This paragraph introduces the concept of using the sample variance (s^2) as an unbiased estimator for the population variance (Σ^2). It sets the stage for understanding why the denominator in the sample variance formula is n-1 instead of n. The paragraph explains the properties of independent observations (x1 through xn) from a population with mean (μ) and variance (Σ^2), and introduces key mathematical tools such as the expectation of a sum, the expectation of a constant times a random variable, and the relationship between variance and expectation of a random variable. The proof is outlined, highlighting the need to calculate the expectation of x^2 and x-bar^2, and the importance of the relationship between variance and expectation in this context.
🧠 Detailed Proof of Unbiased Estimation
This paragraph delves into the detailed mathematical proof that the sample variance s^2 is an unbiased estimator of the population variance Σ^2. It explains the steps of calculating the expectation of the numerator and the expectation of the sum of (X_i - X_bar)^2. The paragraph clarifies how the constant X_bar is treated in the summation and how the expectation is carried through the calculation. It then uses previously established relationships to find the expectation of x^2 and x-bar^2, leading to the conclusion that the expectation of the sample variance s^2 equals Σ^2. The paragraph emphasizes the importance of dividing by n-1 rather than n to achieve an unbiased estimate, and explains the consequences of using n instead.
Mindmap
Keywords
💡sample variance
💡unbiased estimator
💡population variance
💡expectation
💡independent observations
💡variance
💡sum of expectations
💡constant factor
💡sample mean
💡numerator
💡n minus 1
Highlights
The video aims to prove that the sample variance s squared is an unbiased estimator of the population variance Sigma squared.
The proof is based on the formula for sample variance and the concept of unbiased estimation.
The video explains why we divide by n minus 1 and not n in the sample variance formula.
The proof uses the fact that the expectation of a sum is the sum of the expectations.
The video also utilizes the fact that the expectation of a constant times a random variable can be taken outside of the expectation.
A key relationship used in the proof is that the variance of a random variable is equal to the expectation of the square of the random variable minus the square of the expectation.
The expectation of x squared is equal to the variance of X plus the square of the expectation of X.
The expectation of the sample mean squared is equal to the variance of the sample mean plus the square of the expectation of the sample mean.
The proof involves finding the expectation of the sum of (X sub I minus X bar) squared.
When summing from 1 through n, X bar is a constant, allowing for simplification of the summation.
The middle term in the summation works out to 2 n times X bar squared minus n times X bar squared, resulting in minus n times X bar squared.
The expectation of the sample variance s squared is the expectation of the sum of (X sub I minus X bar) squared divided by n minus 1.
The expectation of x squared and the expectation of X bar squared are used to find the expectation of the numerator.
The final result of the proof shows that the expectation of the sample variance s squared is equal to Sigma squared, the population variance.
Dividing by n minus 1 in the calculation of sample variance provides an unbiased estimate of the population variance, whereas dividing by n would result in a biased estimator.
The video provides a detailed and rigorous mathematical proof that is valuable for understanding statistical estimation techniques.
The proof demonstrates the importance of using the correct divisor (n-1) in variance calculations to maintain statistical accuracy.
The video is a practical guide for students and professionals seeking to understand the theoretical underpinnings of sample variance calculations.
Transcripts
Browse More Related Video
Another simulation giving evidence that (n-1) gives us an unbiased estimate of variance
The Sample Variance: Why Divide by n-1?
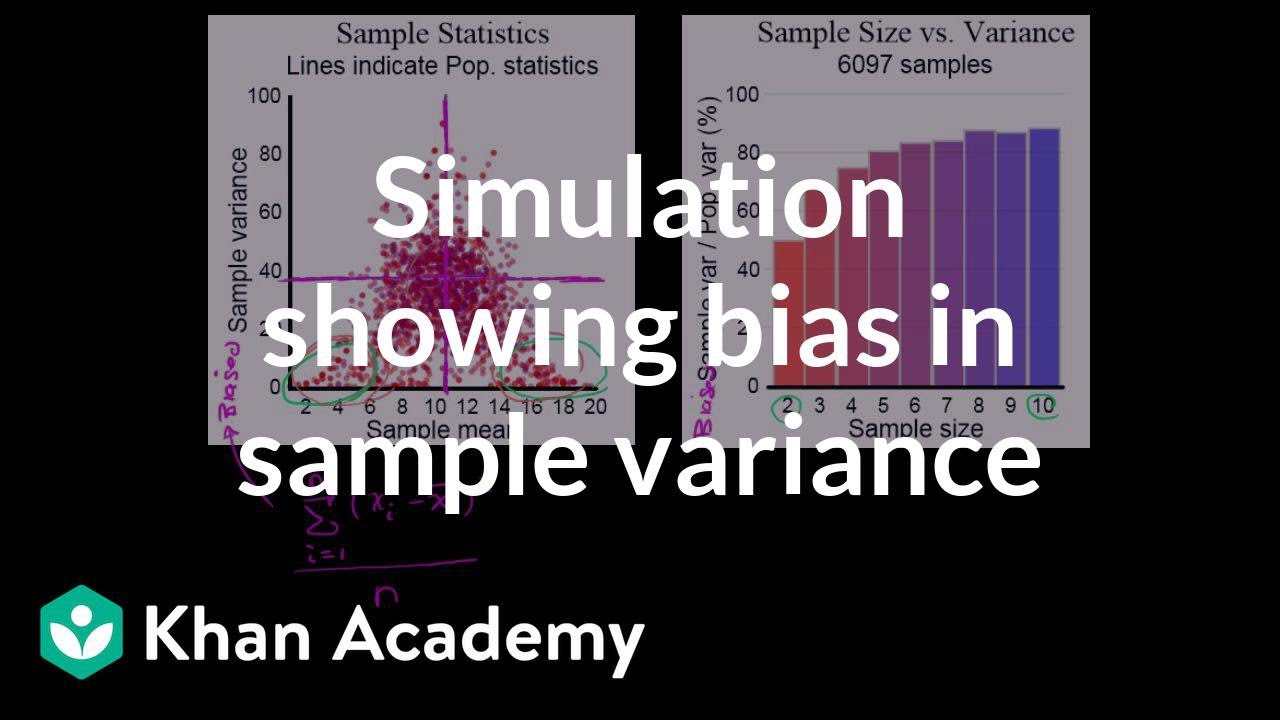
Simulation showing bias in sample variance | Probability and Statistics | Khan Academy
Why do we divide by n-1 and not n? | shown with a simple example | variance and sd
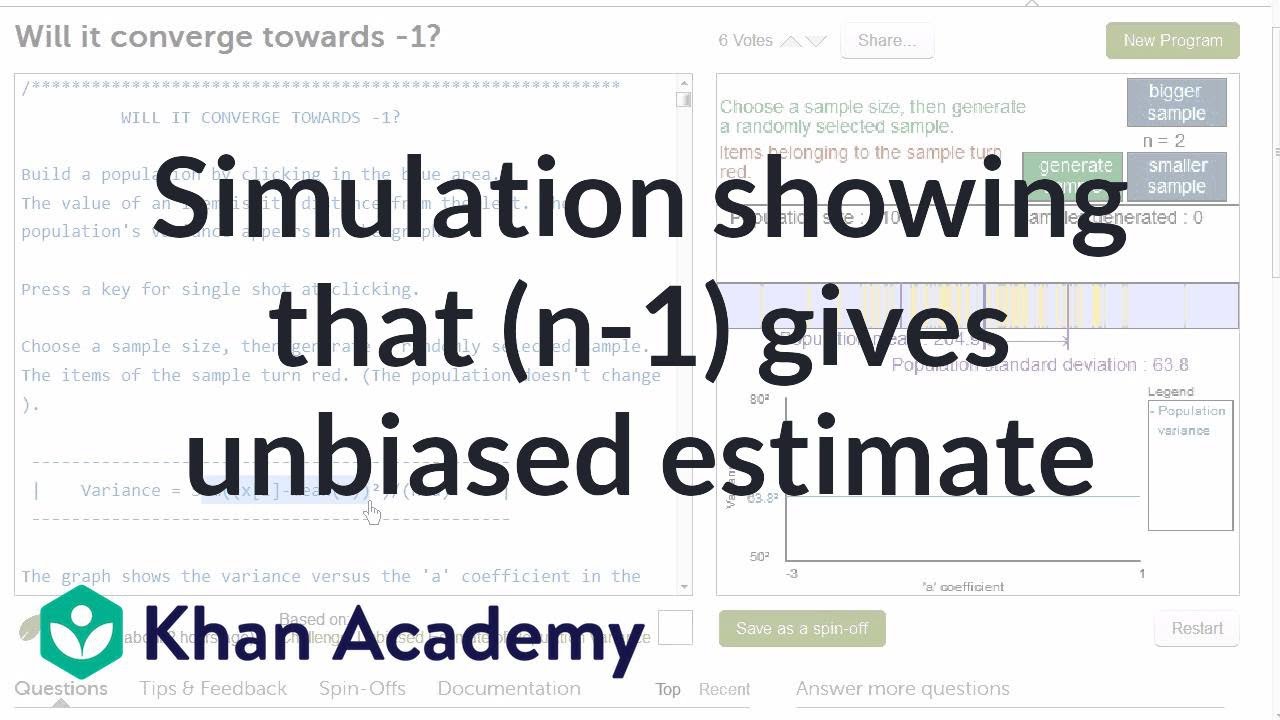
Simulation providing evidence that (n-1) gives us unbiased estimate | Khan Academy
What is an unbiased estimator? Proof sample mean is unbiased and why we divide by n-1 for sample var
5.0 / 5 (0 votes)
Thanks for rating: