Simulation providing evidence that (n-1) gives us unbiased estimate | Khan Academy
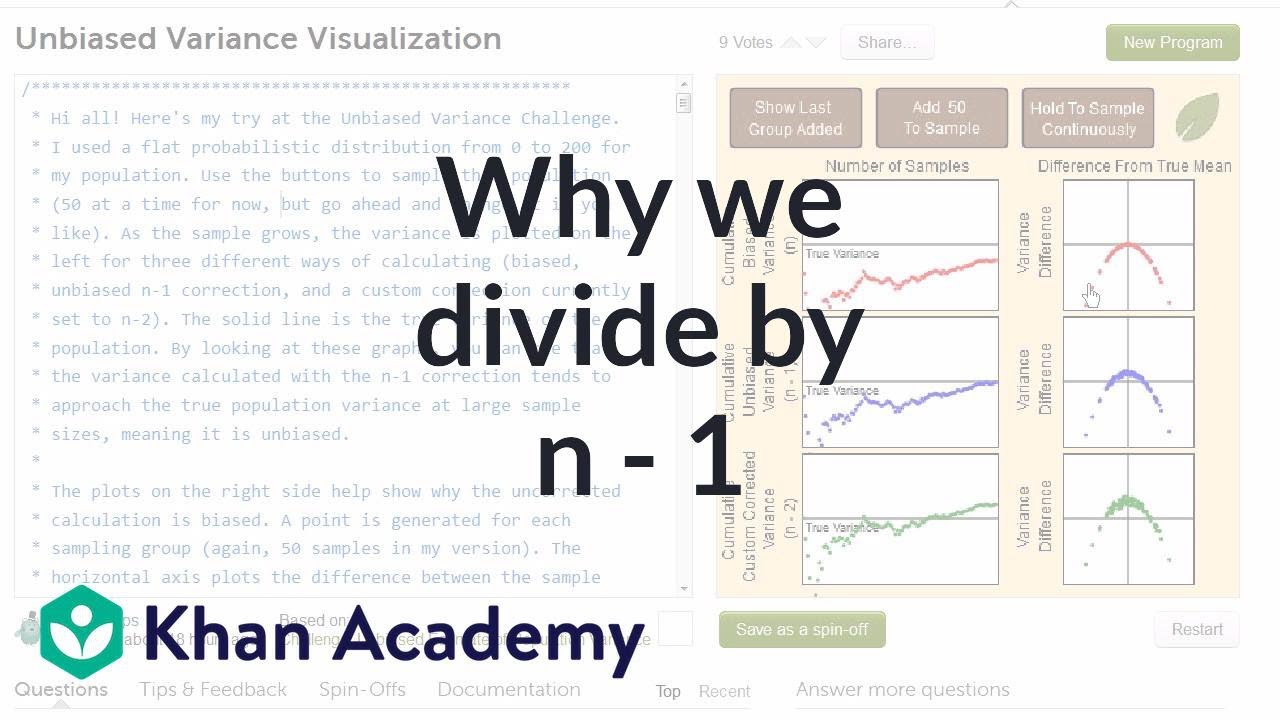
TLDRThe video script from Khan Academy user TETF introduces an interactive simulation that illustrates the rationale behind using n-1 (where n is the sample size) in the calculation of sample variance to achieve an unbiased estimate of the population variance. The simulation allows users to construct a population by clicking in a blue area, from which they can then randomly select samples of varying sizes. For each sample, the simulation calculates the variance using different denominators ranging from n-3 to n+a, and then averages these variances to find the best estimate. The key insight is that the most accurate estimate of the population variance is obtained when the denominator is n-1, which is slightly less than the sample size. This method avoids both underestimating and overestimating the true population variance. The script encourages viewers to engage with the simulation to gain a deeper understanding of statistical concepts.
Takeaways
- 📐 The simulation by TETF (pronounced tet f) from Khan Academy illustrates the rationale behind using n-1 in sample variance calculations.
- 🌟 By constructing a population through random clicks, the simulation allows users to create their own dataset and observe statistical parameters.
- 📈 The population mean and standard deviation, derived from the population variance, are calculated and displayed during the simulation.
- 🔍 The simulation demonstrates taking samples of various sizes and calculating the variance for each, offering insight into statistical sampling.
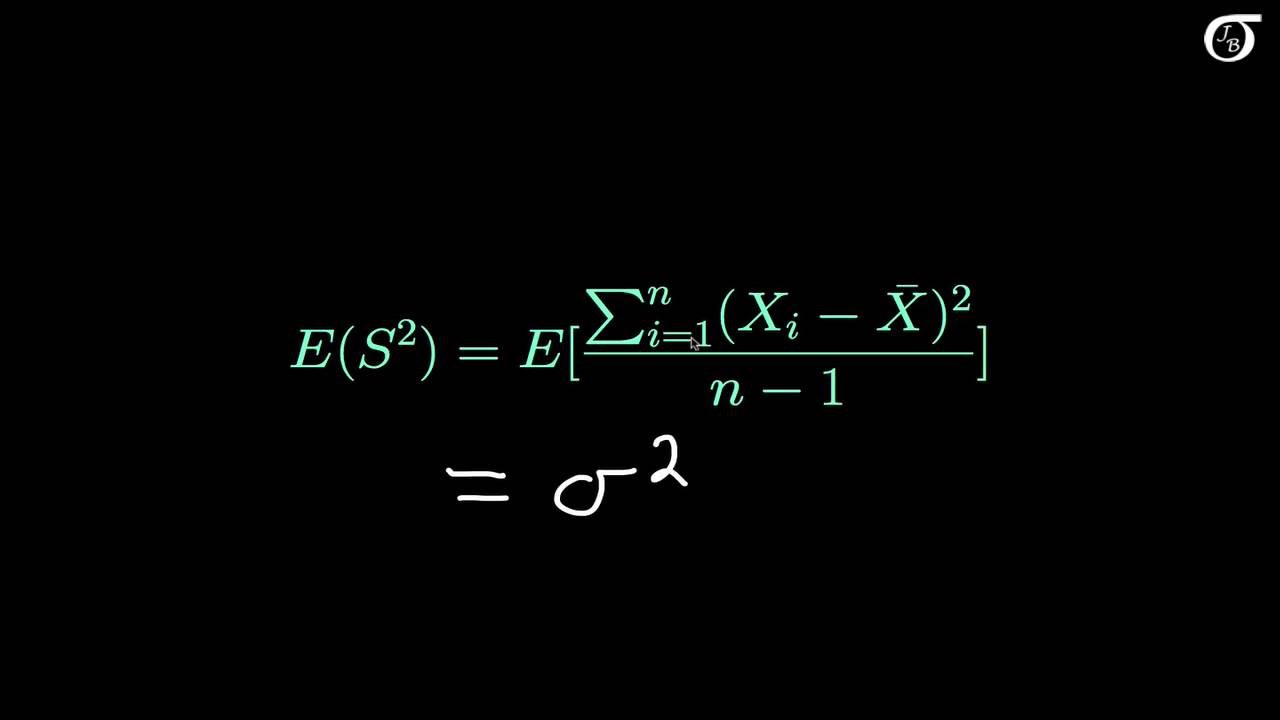
- 🔢 The process involves squaring the difference between each data point and the sample mean, then dividing by n plus a variable (a).
- 📊 The simulation explores different values of 'a' to find the best estimate for the population variance, ranging from n-3 to n+a.
- 🧮 It shows that using n-1 (or a close negative value) as the divisor results in the most accurate estimate of the population variance.
- 📉 For values of 'a' greater than -1, the simulation indicates an underestimation of the population variance.
- 📈 Conversely, for values of 'a' less than -1, the population variance is overestimated.
- 🔁 The simulation emphasizes the importance of averaging the results from many samples to find the most unbiased estimate.
- 🔍 The best estimate consistently approaches n-1, regardless of the sample size, reinforcing the statistical principle for variance calculation.
Q & A
What does the simulation created by TETF on Khan Academy allow users to understand?
-The simulation allows users to gain an intuition as to why we divide by n minus 1 when calculating sample variance and why that gives us an unbiased estimate of the population variance.
How is the population created in the simulation?
-The population is created by clicking in the blue area, which increases the population size with each click.
What parameters does the simulation calculate for the population?
-The simulation calculates the population mean, standard deviation, and population variance.
What is the relationship between the population standard deviation and variance?
-The population variance is the square of the population standard deviation.
How does the simulation determine the best estimate for the population variance?
-The simulation takes the mean of the variances calculated for different values of 'a' (ranging from n minus 3 to n plus a) across many samples to determine the best estimate.
What does the simulation show about the value of 'a' that provides the best estimate of the population variance?
-The best estimate is found when 'a' is close to negative 1, which corresponds to dividing by n minus 1.
What happens when 'a' is less than negative 1 in the simulation?
-When 'a' is less than negative 1, the simulation starts overestimating the population variance.
What happens when 'a' is greater than negative 1 in the simulation?
-When 'a' is greater than negative 1, the simulation starts underestimating the population variance.
Can the simulation be used for samples of different sizes?
-Yes, the simulation can be used for samples of different sizes to determine the best estimate for the population variance.
What is the significance of generating a large number of samples in the simulation?
-Generating a large number of samples helps to refine the estimate and shows that the best estimate is when 'a' is negative 1, especially as the number of samples approaches millions.
Who is credited for creating the simulation discussed in the script?
-TETF, pronounced as 'tet f', is credited for creating the simulation.
What is the purpose of the simulation in the context of statistical learning?
-The simulation serves as an educational tool to help understand the concept of unbiased estimation of population variance through the process of sample variance calculation.
Outlines
📊 Understanding Sample Variance Calculation
The video script introduces a simulation by a Khan Academy user, TETF, which helps in understanding the rationale behind dividing by n-1 when calculating sample variance to obtain an unbiased estimate of the population variance. The simulation allows users to create a population by clicking in a blue area, which increases the population size with each click. The population's parameters, including the mean and standard deviation, are calculated and displayed. The key insight is provided by taking samples of various sizes and calculating the variance for each sample, adjusting the divisor from n-3 to n+a. The simulation shows that the best estimate for population variance is achieved when the divisor is n-1, providing an unbiased estimate. This is demonstrated through multiple samples and averaging the results.
Mindmap
Keywords
💡Sample Variance
💡Unbiased Estimate
💡Population Mean
💡Population Variance
💡Standard Deviation
💡Simulation
💡Sample Size
💡Sum of Squared Differences
💡Dividing by n-1
💡Mean of Variances
💡Khan Academy
💡Computer Science
Highlights
Simulation created by Khan Academy user TETF allows for an intuitive understanding of why we divide by n-1 in sample variance calculation.
The simulation enables users to construct a population by clicking in a blue area, increasing the population size with each click.
The population mean and standard deviation are calculated and displayed during the population construction process.
Population variance is derived from the standard deviation and displayed as the squared value of the standard deviation.
The simulation demonstrates the process of taking samples from the population and calculating variance for each sample.
Variance is calculated by summing the squared differences between each data point and the sample mean, then dividing by n plus a varying value of 'a'.
The simulation explores different values of 'a' to find the best estimate for the population variance by averaging variances across numerous samples.
When 'a' is high, the simulation underestimates the population variance; when 'a' is low, it overestimates.
The optimal estimate for population variance is found when 'a' is close to -1, corresponding to dividing by n-1.
The simulation shows that dividing by n or n+0.05 results in underestimating the population variance.
Using n-1.05 or n-1.5 leads to overestimating the population variance.
The simulation can be repeated for samples of different sizes to validate the findings.
With a larger sample size of 6, the simulation consistently shows that dividing by n-1 provides the best estimate of population variance.
The simulation suggests that with millions of samples generated, the estimate using n-1 as the divisor would be the most accurate.
The simulation provides a practical application for understanding the statistical concept of unbiased estimation of population variance.
TETF's simulation is commended for its innovative approach to explaining a complex statistical concept in an accessible and visual manner.
The simulation encourages active participation by inviting users to construct their own populations and observe the effects on variance calculation.
The process of generating multiple samples and averaging their variances is key to understanding the unbiased estimate of population variance.
Transcripts
Browse More Related Video
Another simulation giving evidence that (n-1) gives us an unbiased estimate of variance
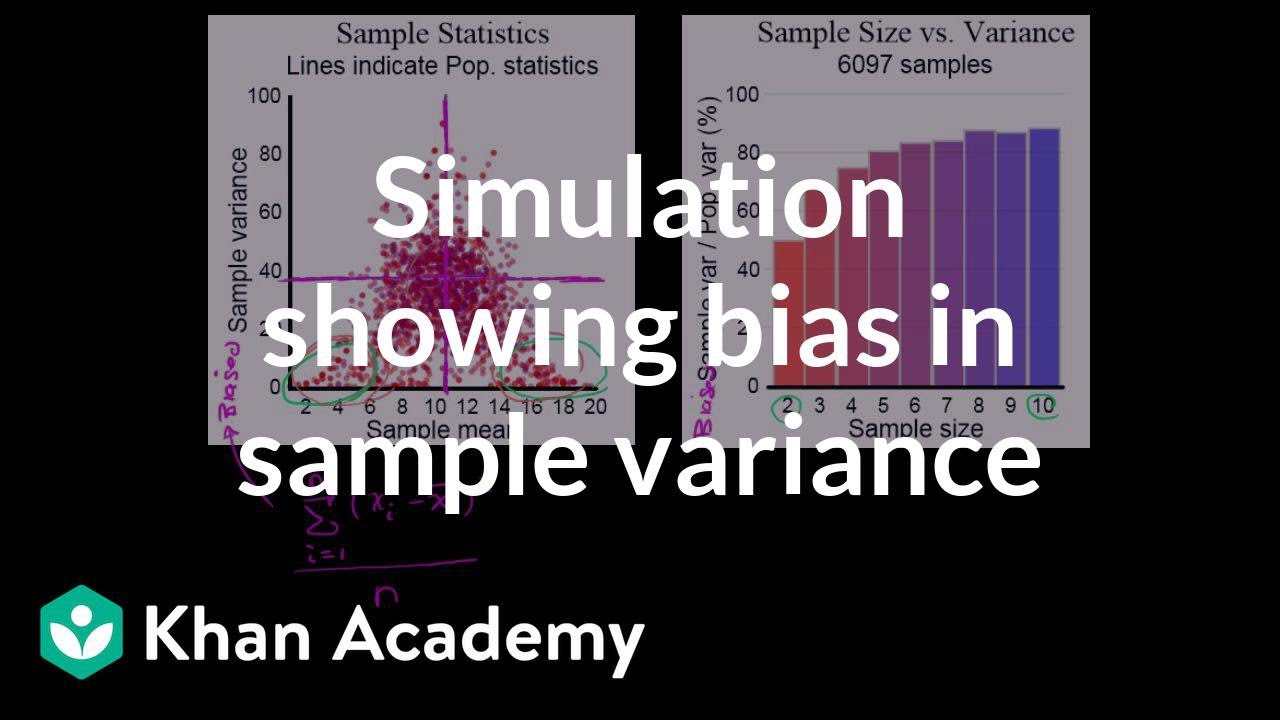
Simulation showing bias in sample variance | Probability and Statistics | Khan Academy
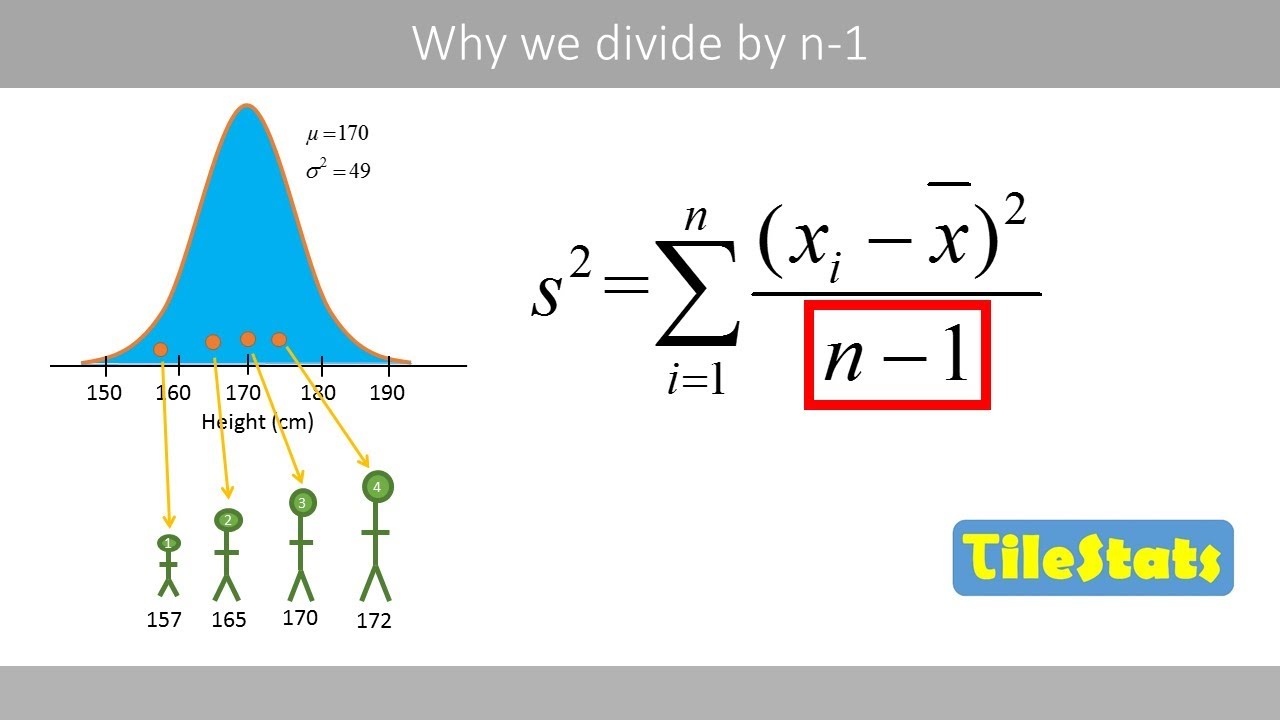
Why do we divide by n-1 and not n? | shown with a simple example | variance and sd
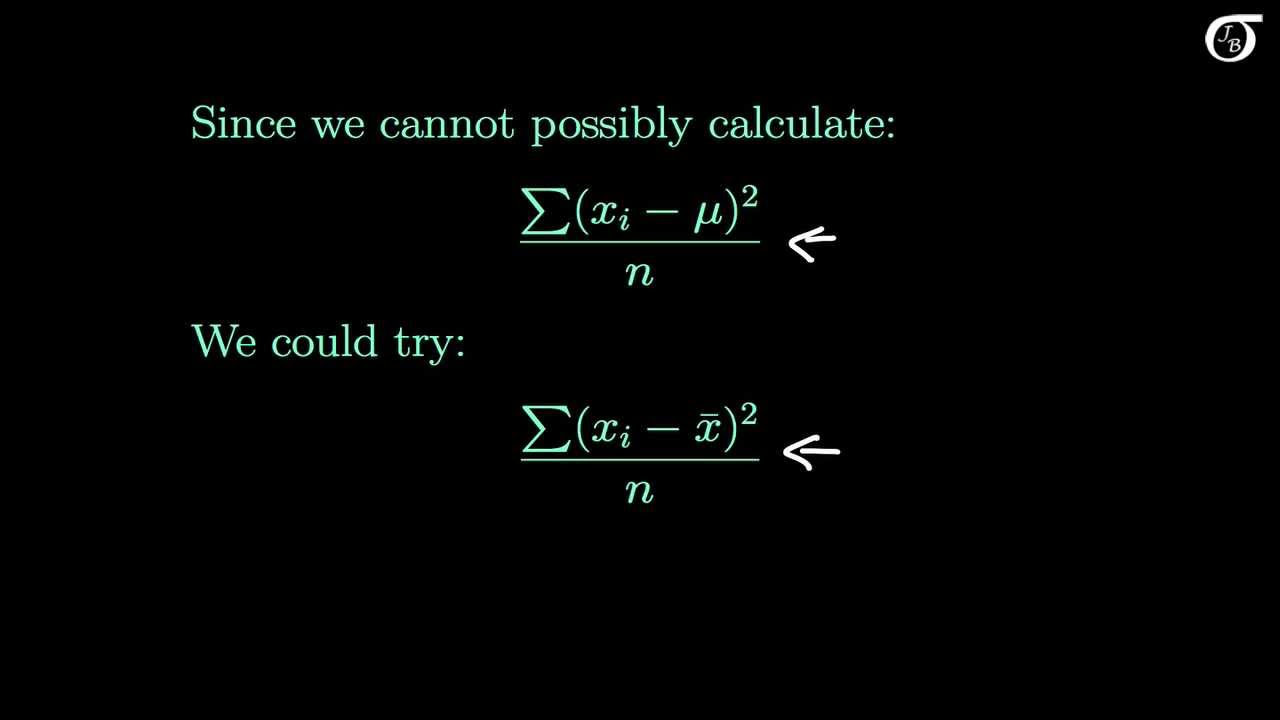
The Sample Variance: Why Divide by n-1?
Proof that the Sample Variance is an Unbiased Estimator of the Population Variance
Statistics: Sample variance | Descriptive statistics | Probability and Statistics | Khan Academy
5.0 / 5 (0 votes)
Thanks for rating: