What is logarithm? | Math, Statistics for data science, machine learning
TLDRThe video script explains the concept of logarithmic functions and their significance in data science and machine learning. It uses a simple banking example to illustrate how logarithms can reverse the process of exponentiation, helping to determine the time it takes for an investment to grow. The script further discusses the practical application of logarithms in data analysis for comparing company revenues and in machine learning to normalize data and prevent model bias. It also touches on the use of logarithms in measuring earthquakes, emphasizing their importance in various fields.
Takeaways
- 📈 The logarithmic (log) function is the inverse of the exponent function, used to solve for the input value that, when raised to a certain power, equals a given output.
- 🏦 The concept is explained using a 'magic bank' analogy, where an initial investment is compounded annually and the log function helps determine the number of years required to reach a certain balance.
- 🔢 Logarithms are commonly used with base 10 (log10) in data analysis, with log10(1) equal to 0, log10(10) equal to 1, and so on, following the pattern of increasing by 1 for each order of magnitude.
- 📊 In data visualization, using a log scale on the y-axis can help compare values with large disparities, making smaller values more discernible against larger ones.
- 🏢 The script provides an example of comparing company revenues, where a log scale allows for a clearer comparison between companies with significantly different earnings.
- 🤖 In machine learning, log transformation is used to normalize data with extreme values, preventing certain data points from disproportionately influencing the model's predictions.
- 🧾 The example of predicting loan approval is used to illustrate how log transformation can balance the influence of different features, such as income, on the outcome.
- 🌋 The script also mentions the use of logarithms in measuring earthquakes, where each whole number increase on the Richter scale represents a tenfold increase in the earthquake's power.
- 🌍 The devastation of an earthquake with a magnitude of 7 is explained as being much more severe than those with lower magnitudes due to the logarithmic nature of the scale.
- 📈 Logarithms have various applications in data analysis and machine learning, including in loss functions, and provide a foundational understanding for these fields.
- 📚 The video aims to enhance understanding of logarithms and their significance in data science and machine learning, encouraging viewers to share the knowledge with others.
Q & A
What is a logarithmic function?
-A logarithmic function, or log, is the inverse operation to exponentiation. It calculates the exponent to which a base must be raised to produce a given value.
How does the concept of logarithm relate to the example of money in the bank?
-In the bank example, the initial investment (base) is grown by a factor (the interest rate) over a period of time. The logarithm helps to determine the time required to reach a certain amount (final value) starting from the base investment, assuming a constant growth rate.
What is the significance of logarithms in data science and machine learning?
-Logarithms are significant in data science and machine learning because they can help in normalizing data with skewed distributions, improving the performance of machine learning models, and in visualizing data where there are large differences in values.
How does using a log axis in a chart improve the comparison of values with different scales?
-A log axis compresses the scale, making it easier to compare values that span a wide range. It allows the visualization of both small and large values on the same axis without the smaller values being overshadowed by the larger ones.
What is the formula for converting a logarithm with base 10 to an exponent?
-The formula to convert log base 10 to an exponent is to write it as 10 to the power of the logarithm value. For example, log base 10 of 100 is 2, which can be written as 10^2.
How does the log transformation help in machine learning?
-Log transformation helps in machine learning by normalizing data with skewed distributions, which can improve the accuracy of models. It reduces the influence of outliers and brings all values to a more comparable scale.
What is the difference between an exponent and a logarithm?
-An exponent indicates what power a number (base) is raised to, while a logarithm finds the power to which the base must be raised to obtain a given number. Essentially, logarithms are the inverse operation of exponentiation.
How does the Richter scale for earthquakes use logarithms?
-The Richter scale for measuring earthquakes is logarithmic, meaning each whole number increase on the scale represents a tenfold increase in the amplitude of the seismic waves and approximately 31.6 times more energy release.
What is the role of logarithms in loss functions?
-Logarithms can be used in loss functions to penalize large errors more heavily than small ones, which can be particularly useful in certain types of regression problems where the impact of errors is not linear.
What is the general formula for converting a logarithm to an exponent?
-The general formula for converting a logarithm to an exponent is b^log_b(x) = x, where b is the base and x is the value you want to find the exponent for.
Why is it important to use log transformations in data analysis?
-Log transformations are important in data analysis because they can stabilize variance and make the data more normally distributed, which is beneficial for many statistical analyses and machine learning algorithms that assume normality.
Outlines
📈 Introduction to Logarithmic Functions and Their Role in Data Science
This paragraph introduces the concept of logarithmic functions, emphasizing their importance in data science and machine learning. It begins with a simple analogy of a 'magic bank' to explain how exponential growth works, using the example of an investment that multiplies by 5x each year. The explanation then transitions to the concept of logarithms as the inverse operation of exponentiation, which is used to determine the number of years required to grow an initial investment to a given amount. The paragraph also touches on the use of logarithms in data analysis, particularly in visualizing and comparing large datasets, and mentions the use of log transformations in machine learning to handle data with varying scales.
📊 Application of Logarithms in Data Visualization and Machine Learning
The second paragraph delves into the practical applications of logarithms in data visualization and machine learning. It discusses how using a log scale can improve the comparison of data points with large differences in magnitude, as illustrated by a bar chart comparison of company revenues. The paragraph also explains how log transformations can help in machine learning by normalizing the impact of extreme values, thus preventing model bias. Additionally, it provides a real-world example of how logarithms are used in measuring earthquakes, highlighting the logarithmic scale's ability to quantify the relative power of earthquakes.
Mindmap
Keywords
💡Logarithmic Function
💡Exponent
💡Data Science
💡Machine Learning
💡Pandas DataFrame
💡Bar Chart
💡Log Axis
💡Credit Score
💡Income
💡Earthquake Measurement
💡Loss Function
Highlights
Explaining the concept of logarithmic functions in simple terms.
Using a bank investment example to illustrate the growth of an investment over time.
The significance of logarithmic functions in data science and machine learning.
Logarithmic functions as the inverse of exponentiation.
Calculating the number of years required for an investment to grow using logarithms.
The relationship between logarithms and their bases, such as log base 10 being 1.
Applying logarithms to data analysis, such as comparing company revenues.
The issue of skewed data visualization in bar charts due to large discrepancies in data values.
Using log axes in data visualization to better compare smaller values among larger ones.
The impact of extreme data points on machine learning models and how to mitigate it with logarithmic transformation.
Logarithmic transformation of income data for a loan approval prediction model.
The practical application of logarithms in measuring earthquakes and their magnitudes.
The devastating impact of a logarithmic scale earthquake as experienced in Gujarat, India.
The importance of understanding logarithms for data analysis and machine learning tasks.
The use of logarithms in loss functions within machine learning.
An introduction to the next video on an interesting math and statistics topic for data science and machine learning.
Encouraging viewers to share the video for a better understanding of logarithms.
Transcripts
Browse More Related Video
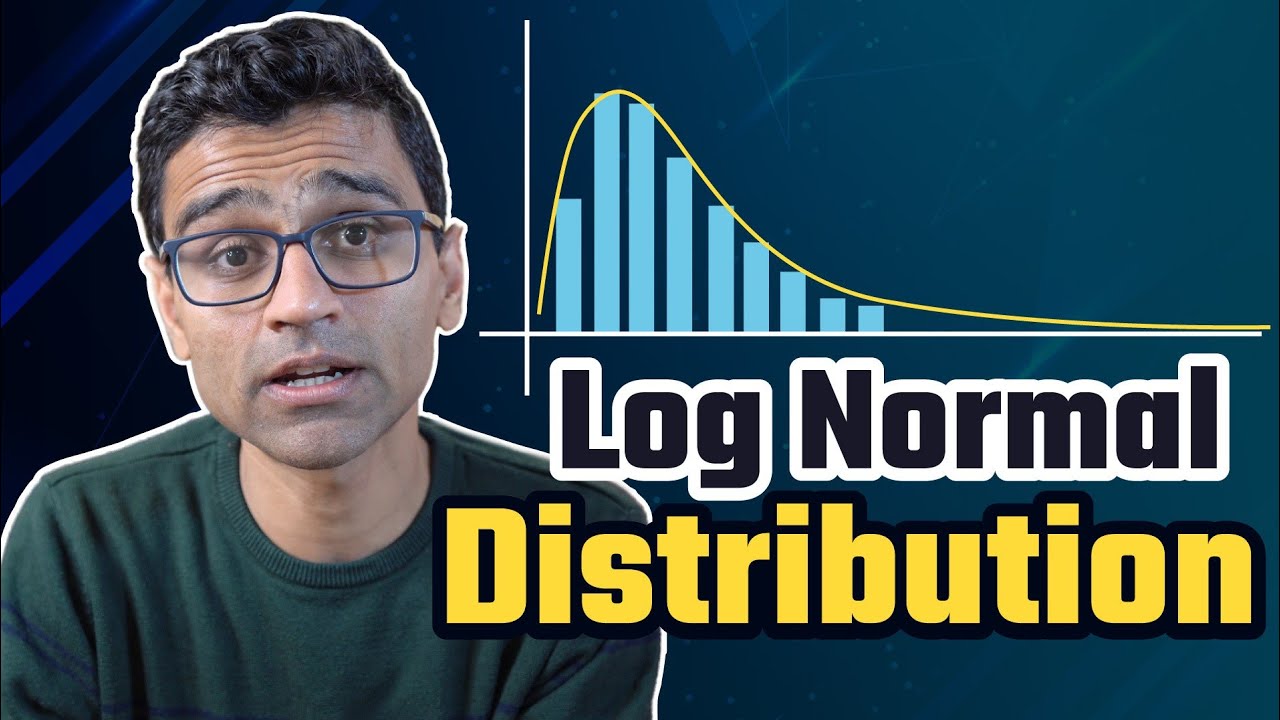
Log normal distribution | Math, Statistics for data science, machine learning

Normal Distribution and Z Score | Math, Statistics for data science, machine learning

Introduction to Logarithms (1 of 2: Definition)
Statistics 101: Linear Regression, Outliers and Influential Observations

Business Calculus -- Math 1329 -- Section 4.2 -- Logarithmic Functions

What is Ressidual Sum of Squares(RSS) in Regression (Machine Learning)
5.0 / 5 (0 votes)
Thanks for rating: