Statistics 101: Linear Regression, Outliers and Influential Observations
TLDRIn this informative video, Brandon delves into the crucial topic of outliers and influential observations in simple linear regression, a concept often overlooked but vital in statistical analysis. He uses a practical example, analyzing used car data to illustrate how outliers can significantly impact regression models, affecting predictions and conclusions. Through clear explanations and visual aids, viewers learn the importance of exploratory data analysis, the impact of outliers on regression lines, and how to identify and address these data points. The video emphasizes the necessity of accurate data interpretation in making informed decisions, particularly in fields like machine learning and data science.
Takeaways
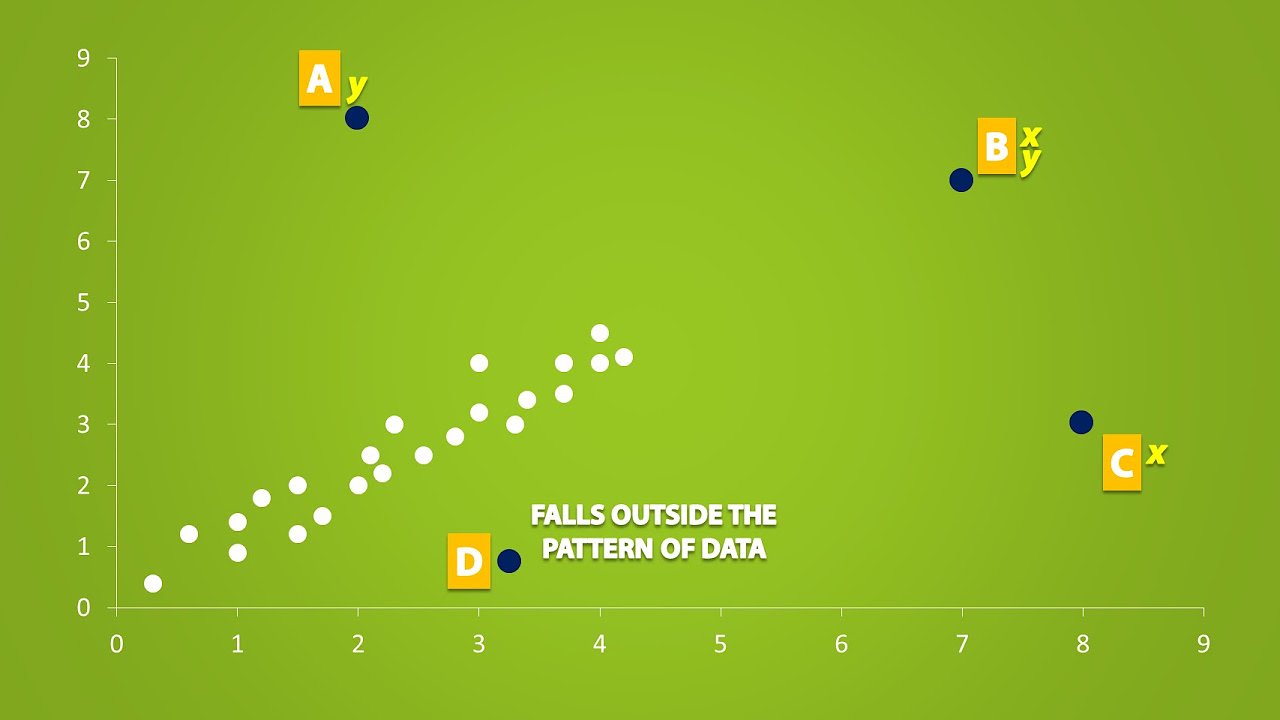
- 📊 The importance of scatter plots and exploratory data analysis in identifying outliers and influential observations in data.
- 🔍 Outliers are data points that appear out of the norm or extreme, and they can significantly affect the model.
- 📈 Influential observations may not necessarily be outliers but can dramatically change the regression output and model significance.
- 🤔 A point can be an influential observation if it has a large residual value even if it falls within the range of values for the variable.
- 🧐 The slope of the regression line can be affected by outliers or influential points, pulling it in the direction of the outlier.
- 📝 Always question the data for errors such as fat finger errors, which can lead to incorrect data points.
- 📚 The mention of 'The One Hundred-Page Machine Learning Book' as a recommended resource for understanding machine learning concepts.
- 🚀 The impact of removing an outlier can significantly change the regression model, such as increasing the explained variance and altering the coefficient.
- 📉 A large standardized residual (> 2) indicates an outlier, which can skew the model's accuracy.
- 🔄 The demonstration of how removing an outlier can improve the model's fit, reducing the standard error and increasing the R-squared value.
- 🔍 The concept of leverage in regression is teased for a future video, highlighting the influence of high leverage points on the regression line.
Q & A
What is the primary purpose of the GoFundMe link mentioned in the video?
-The GoFundMe link in the video is intended to gather donations for professionally closed captioning the videos. This effort is to make the content more accessible to all viewers.
Why does the presenter emphasize the importance of exploratory data analysis and scatter plots?
-The presenter emphasizes the importance of exploratory data analysis and scatter plots because they are simple yet effective tools for visualizing and understanding data patterns, including identifying potential outliers and irregularities.
What is the main topic of the video in Brandon's basic statistics series?
-The main topic of the video is 'Simple Linear Regression,' with a focus on understanding outliers and influential observations in regression data.
How do outliers and influential observations affect regression models?
-Outliers and influential observations can significantly affect regression models by altering the model's output, such as changing the slope of the regression line, influencing the model's accuracy and significance, and potentially leading to incorrect conclusions.
What example is used in the video to illustrate simple linear regression?
-The example used in the video to illustrate simple linear regression is a dataset on used Toyota Camry SE Sedans, analyzing the relationship between the car's mileage and its selling price.
What does a high residual value indicate in the context of regression analysis?
-In the context of regression analysis, a high residual value indicates a significant deviation of an observation from the predicted value, suggesting it might be an outlier or an influential point in the dataset.
What book does the presenter recommend for learning about machine learning, and why?
-The presenter recommends 'The One Hundred-Page Machine Learning Book' by Andry Burkov. The book is praised for its ability to distill complex machine learning concepts into clear, concise explanations, making it valuable for those new to the field.
What steps should be taken if an outlier is identified in a dataset?
-If an outlier is identified, one should investigate its cause, like potential data recording errors or if it suggests a different model. Decisions should be made whether to include or exclude it based on its relevance and impact on the analysis.
How did removing an outlier in the used car dataset affect the regression model?
-Removing an outlier from the used car dataset dramatically changed the regression model. It increased the R squared value, indicating a better fit, and adjusted the rate at which a car loses value for each mile driven.
What is the upcoming topic teased for the next video in the series?
-The upcoming topic for the next video in the series is the concept of leverage in regression. It will explore how certain data points with high leverage can significantly influence the regression line, similar to a seesaw effect.
Outlines
📚 Introduction to Basic Statistics and Regression
The video begins with Brandon, the host, welcoming viewers to the next installment of his basic statistics series. He encourages new viewers and thanks returning ones, suggesting that they share the video if they find it helpful. Brandon also mentions a GoFundMe link for those who can contribute to get the videos professionally closed captioned. The main topic of the video is introduced as simple linear regression, focusing on outliers and influential observations, which can significantly affect the model in both simple and complex regression techniques, as well as machine learning. Brandon also endorses 'The One Hundred-Page Machine Learning Book' by Andry Burkov, which he found to be a game-changer for understanding machine learning concepts.
🔍 Identifying Outliers and Influential Observations
In this paragraph, Brandon emphasizes the importance of scatter plots and exploratory data analysis in identifying outliers and influential observations. Outliers are data points that are outside the norm and can influence the model in various ways, such as pulling the regression line in their direction or falling outside the general pattern of the data. Influential observations, on the other hand, may not necessarily be outliers but can still dramatically change the regression output. Brandon uses a scatter plot of used Toyota Camry SE Sedan data to illustrate these concepts, pointing out a specific data point (the blue diamond) that seems out of place and warrants further investigation. He also discusses the potential real-world questions to ask when encountering such points, such as data entry errors or the need for a different model like a curvilinear one.
📊 Analyzing Regression Output and Residuals
Brandon continues by analyzing the regression output, focusing on the R-squared value, standard error, and the ANOVA table. He explains the significance of these statistical measures and how they can change when an outlier is present in the data. The video then presents a residual plot that highlights the outlier's large residual compared to the rest of the data points. Brandon calculates the standardized residual for the suspicious data point, confirming it as an outlier. He proceeds to re-analyze the data without the outlier and notes the significant changes in the regression equation, R-squared value, standard error, F value, and significance level, underscoring the impact of a single outlier on the model's accuracy and interpretation.
🚗 Impact of Outlier Removal on Regression Analysis
This section demonstrates the effect of removing the identified outlier on the regression analysis. Brandon shows that after removing the outlier, the data points fit more neatly around the regression line, and the car's value depreciation per mile driven increases significantly, indicating a more accurate model. The R-squared value increases from 0.296 to 0.691, showing that a larger percentage of the variance in car price is explained by mileage. The standard error is also reduced by half, and the F value and significance level change dramatically, reinforcing the importance of identifying and addressing outliers in data analysis. Visual comparisons of the regression line, confidence intervals, and prediction intervals with and without the outlier are provided to illustrate these changes.
🔮 Teasing the Concept of Leverage in Regression for Future Discussion
In the final paragraph, Brandon teases the concept of leverage in regression, which will be the focus of the next video. He explains that high leverage points, where a data point deviates significantly from the rest for the independent variable, can tilt the regression line towards it, similar to a lever. The video introduces the formula for calculating leverage and the decision rule for identifying high leverage points. Brandon emphasizes that understanding leverage is crucial for accurately building and interpreting regression models, as it can lead to more precise predictions and avoid potential errors.
Mindmap
Keywords
💡Outliers
💡Influential Observations
💡Regression Line
💡Residuals
💡R-squared
💡Standard Error
💡ANOVA Table
💡F-statistic
💡Scatter Plot
💡Simple Linear Regression
💡Machine Learning
Highlights
The video discusses the concept of outliers and influential observations in simple linear regression, emphasizing their significant impact on the model.
Outliers can dramatically affect the model, pulling the regression line in the direction of the outlier and changing the slope.
Influential observations may not necessarily be outliers but can change the regression output significantly.
The video uses a dataset of used Toyota Camry SE Sedans to illustrate the concepts, with mileage on the x-axis and selling price on the y-axis.
The initial regression model shows that for every mile driven, the car's value decreases by 9.37 cents.
The R-squared value of 0.2963 indicates that about 30% of the variance in the price is explained by the number of miles on the car.
The presence of an outlier, represented by a blue diamond, is suspected due to its deviation from the general pattern of data points.
The video emphasizes the importance of scatter plots and exploratory data analysis in identifying outliers and influential observations.
A point can be an outlier if it has an extremely large residual value, even if it falls within the range of values for the variable.
The video introduces 'The One Hundred-Page Machine Learning Book' by Andry Burkov as a valuable resource for understanding machine learning concepts.
The impact of removing an outlier is demonstrated, showing how it can more than double the amount of variance explained by the model.
The standard error of the model is significantly reduced by removing the outlier, indicating a better fit of the remaining data points to the regression line.
The F value and significance level of the model change drastically after removing the outlier, highlighting the outlier's influence on model statistics.
The video visually compares the regression line with and without the outlier, showing the substantial effect on the slope of the line.
The concept of leverage in regression is teased for the next video, explaining how high leverage points can tilt the regression line towards them.
The video concludes with the message that identifying and addressing outliers and influential observations is crucial for accurate modeling and prediction in statistics, business, and data science.
Transcripts
Browse More Related Video
The Effects of Outliers and Extrapolation on Regression (2.4)

10.2.4 Regression - Outliers and Influential Points

Median, Mean, Mode, Percentile | Math, Statistics for data science, machine learning

10.2.2 Regression - Three Methods for Finding the Equation of the Regression Line

REGRESSION: Non-Linear relationships & Logarithms

What is Ressidual Sum of Squares(RSS) in Regression (Machine Learning)
5.0 / 5 (0 votes)
Thanks for rating: