What is Ressidual Sum of Squares(RSS) in Regression (Machine Learning)
TLDRThe video script delves into the concept of the Residual Sum of Squares (RSS) in the context of regression analysis, a fundamental technique in machine learning and data science. It explains how RSS measures the discrepancy between the actual data points and those predicted by a regression model. The video emphasizes the importance of minimizing RSS to achieve the best-fit line in linear regression, detailing the process of calculating coefficients (beta 0 and beta 1) that result in the minimum RSS. It also touches on the relationship between RSS and Mean Square Error (MSE), highlighting their equivalence in reflecting model accuracy. The content is aimed at beginners and intermediate learners interested in machine learning and data science, offering a comprehensive understanding of these core concepts.
Takeaways
- 📊 The meaning of the time residual sum of squares (RSS) is discussed in the context of regression and machine learning.
- 📈 RSS is related to the mean square error (MSE), both are used to measure the quality of a regression model.
- 🔍 The focus of regression analysis is to predict the value of Y given the values of X.
- 🤖 In linear regression, the model takes the form Y = beta0 + beta1*X, where beta0 and beta1 are coefficients to be determined.
- 📉 Residuals represent the differences between the actual data points and the points on the regression line.
- 🔢 The residual sum of squares is calculated by summing the squares of the residuals (e1, e2, e3, ..., en).
- 🏆 The goal of linear regression is to minimize the RSS, which indicates a better fit of the model to the data.
- 📝 The values of beta0 and beta1 that minimize the RSS can be calculated using the formulas provided in the script.
- 🎯 The script also mentions a machine learning 101 class and encourages viewers to join for a comprehensive understanding of these concepts.
- 🌐 The presenter invites viewers to subscribe to their channel and follow their content for more lessons on machine learning and data science.
Q & A
What is the main topic of the video?
-The main topic of the video is the explanation of the time residual sum of squares (RSS) in regression and its significance in machine learning and data science.
What does the acronym 'RSS' stand for in the context of regression analysis?
-In the context of regression analysis, 'RSS' stands for Residual Sum of Squares.
How is the Residual Sum of Squares (RSS) calculated?
-The Residual Sum of Squares (RSS) is calculated by taking the difference between the actual values (Y) and the predicted values (ŷ) from the regression line, squaring each of these differences, and then summing them up.
What is the goal of minimizing the RSS in regression analysis?
-The goal of minimizing the RSS in regression analysis is to find the best-fit line that closely approximates the data points, indicating a good model fit.
What is the relationship between the variables X and Y in a regression analysis?
-In a regression analysis, the relationship between the variables X and Y is that X is the independent variable and Y is the dependent variable, with the aim to predict the values of Y given the values for X.
What is the linear regression function mentioned in the script?
-The linear regression function mentioned in the script is Y = beta0 + beta1 * X, where beta0 is the y-intercept and beta1 is the slope of the regression line.
How are the coefficients beta0 and beta1 determined in a linear regression?
-The coefficients beta0 and beta1 are determined by minimizing the RSS, which is achieved by using the method of least squares to find the best-fit line to the data.
What is the significance of the least squares method in regression analysis?
-The least squares method is significant in regression analysis as it helps in finding the line that minimizes the RSS, thus providing the best fit to the data points.
What is the role of the mean values in determining the coefficients beta0 and beta1?
-The mean values of X (X bar) and Y (Y bar) play a crucial role in determining the coefficients beta0 and beta1, as they are used in the formulas to calculate these coefficients that minimize the RSS.
How does the video script relate the concepts of mean square error (MSE) and RSS?
-The video script relates the concepts of mean square error (MSE) and RSS by explaining that both are measures used to assess the quality of the fit of a regression model, with the aim of minimizing these values to improve the model's accuracy.
What additional resource is provided for those interested in learning more about machine learning and data science?
-For those interested in learning more about machine learning and data science, the script mentions a link to a machine learning 101 lesson series in the description box, which is designed to be accessible for beginners, intermediates, and enthusiasts.
Outlines
📊 Introduction to Time Residual Sum of Squares (RSS) in Regression
The paragraph introduces the concept of the Time Residual Sum of Squares (RSS) in the context of regression analysis, machine learning, and data science. It explains the motivation behind discussing RSS, which is to understand terms that may be different but carry the same meaning in various learning contexts. The explanation begins with a basic overview of RSS, transitioning into Mean Square Error (MSE), and setting the stage for a deeper dive into the concept of RSS. The paragraph emphasizes the importance of regression analysis in predicting values of Y given values for X and outlines the process of finding a relationship between these variables. It also introduces the linear regression model in the form of Y = beta0 + beta1X and explains how coefficients are calculated to estimate the value of Y. The paragraph concludes with a discussion on the residual procedural, which is the difference between the actual data points and those calculated by the regression line, highlighting the significance of this concept in understanding data relationships and model fitting.
📈 Calculation and Minimization of Residual Sum of Squares (RSS)
This paragraph delves into the specifics of calculating the Residual Sum of Squares (RSS) and how to minimize it to achieve the best fit in a regression model. It begins by explaining the concept of residuals as the differences between actual values and those predicted by the regression line. The paragraph then describes the process of squaring these residuals and summing them up to obtain the RSS. It emphasizes that the goal of linear regression is to minimize the RSS, which is achieved by finding the optimal values for the coefficients beta0 and beta1. The optimal values are calculated using the mean of X (X bar) and Y (Y bar) values. The paragraph also provides the formulas for calculating beta1 and beta0 to minimize the RSS, which is crucial for fitting the best possible regression line to the data. The summary concludes with a reiteration of the importance of minimizing both MSE and RSS to obtain an accurate and reliable regression model.
🎓 Conclusion and Invitation to Machine Learning 101
In this final paragraph, the speaker concludes the discussion on the Residual Sum of Squares (RSS) and its significance in regression analysis. The speaker reiterates the importance of minimizing RSS and Mean Square Error (MSE) to achieve the best fit for a regression model. The paragraph also serves as a call to action, inviting viewers to subscribe to the channel and participate in the Machine Learning 101 lesson series. The speaker highlights that the Machine Learning 101 series is designed to be accessible for everyone, from beginners to enthusiasts, who are interested in learning about machine learning and data science. The paragraph ends with a thank you note to the viewers and an encouragement to join the next lesson for further insights into the field.
Mindmap
Keywords
💡Regression
💡Mean Square Error (MSE)
💡Residual Sum of Squares (RSS)
💡Beta Coefficients
💡Linear Regression Line
💡Residual
💡Machine Learning 101
💡Data Science
💡Predictive Modeling
💡Scatter Plot
💡Best-fit Line
Highlights
Explanation of the time residual sum of squares (RSS) in regression and machine learning.
The relevance of understanding RSS in the context of the Machine Learning 101 class.
The meaning of Mean Square Error (MSE) in relation to RSS.
The process of predicting values of Y given values for X in regression analysis.
The role of plotting X and Y values as the first step in regression analysis.
The function used in linear regression to relate X and Y, which is Y = beta0 + beta1X.
How linear regression calculates the coefficients beta0 and beta1 to estimate the value of Y.
The concept of the regression line and how it is plotted against X and Y hat.
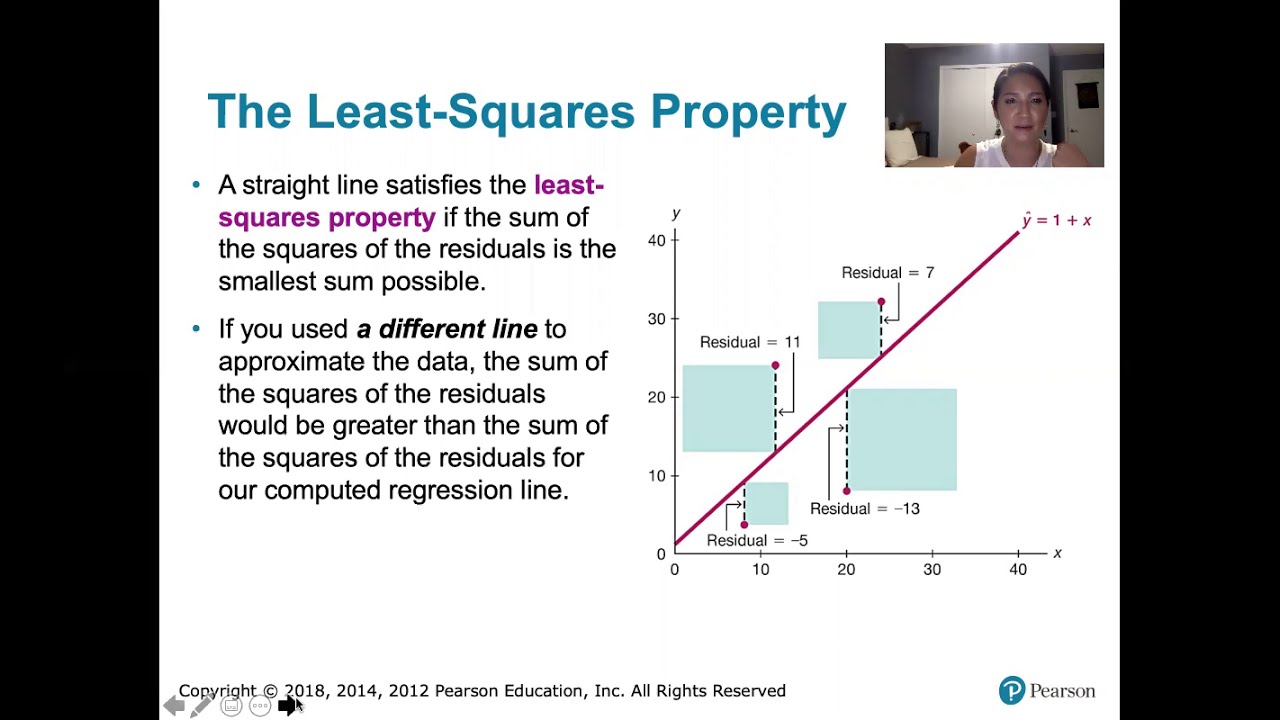
The definition of a residual as the difference between the actual points and the points calculated for the line.
How the residual sum of squares is calculated by summing up the squares of the residuals.
The importance of minimizing the residual sum of squares for finding the best-fit regression line.
The formula for calculating the optimal beta1 that minimizes the RSS.
The method to determine the optimal beta0 for minimizing the RSS.
The conclusion that emphasizes the significance of minimizing both MSE and RSS to achieve the best-fit regression line.
Invitation to subscribe to the channel and join the Machine Learning 101 lesson series.
Transcripts
Browse More Related Video

R Squared Explained in 5 minutes

Introduction To Ordinary Least Squares With Examples
10.2.5 Regression - Residuals and the Least-Squares Property

How to Calculate the Residual
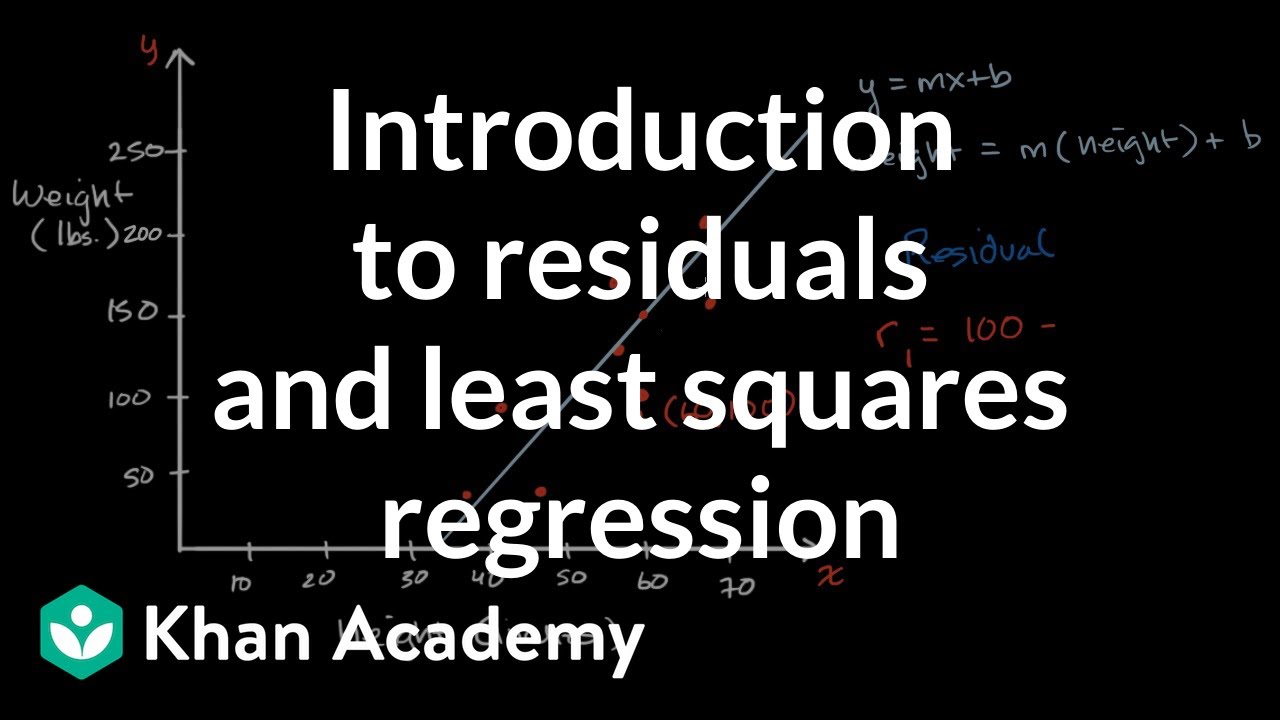
Introduction to residuals and least squares regression
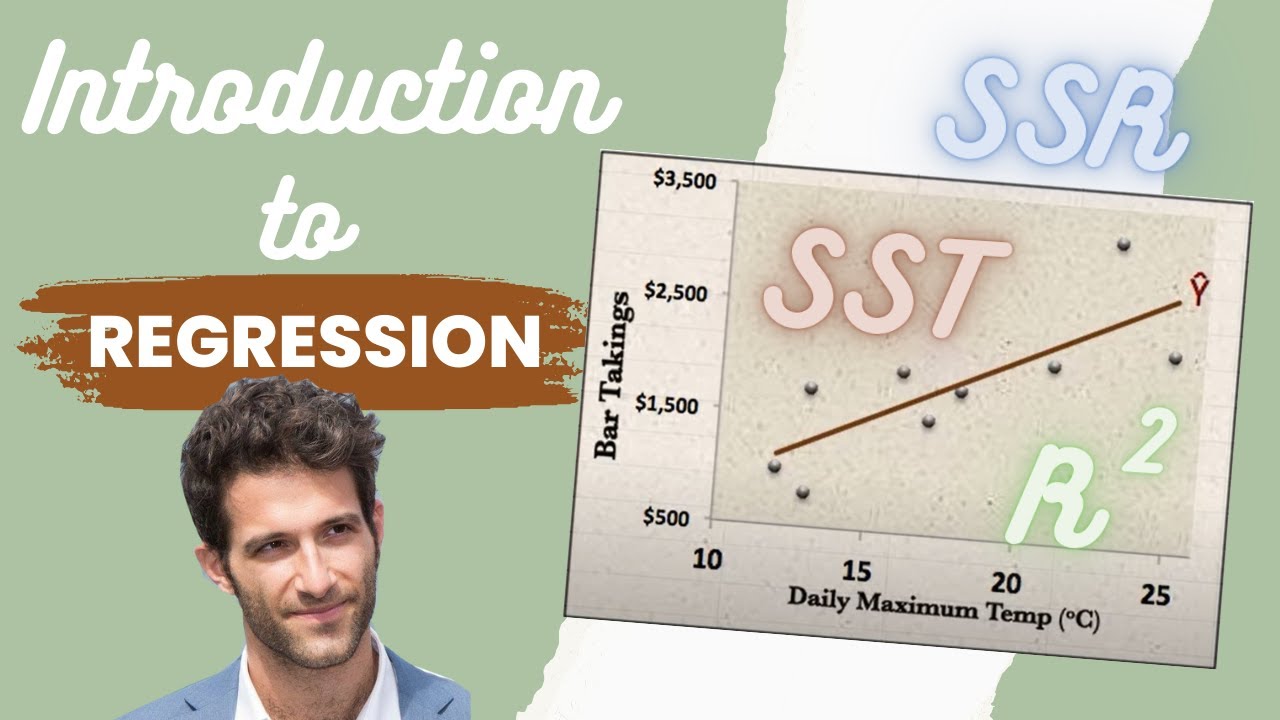
Introduction to REGRESSION! | SSE, SSR, SST | R-squared | Errors (ε vs. e)
5.0 / 5 (0 votes)
Thanks for rating: