Hypothesis Testing Explained | Statistics Tutorial | MarinStatsLectures
TLDRThis video delves into the concept of the sampling distribution and its application in hypothesis testing for a single numeric variable. It uses the example of systolic blood pressure in a population to illustrate how the sampling distribution, which is normally distributed, can be used to calculate the probability of obtaining a sample mean. The video explains the process of standardizing the sample mean and using a Z-score to find the probability of observing a sample mean of 135 given a population mean of 125. It then transitions into the realm of hypothesis testing, setting up a null hypothesis that smokers' mean blood pressure is the same as the healthy population's and an alternative hypothesis that it is greater. The video lays the groundwork for further exploration of hypothesis testing, introducing the p-value as a measure of the likelihood of observing the sample data if the null hypothesis were true.
Takeaways
- 📊 Understanding the sampling distribution is crucial for building a hypothesis test, especially for a single numeric variable.
- 🧠 The sampling distribution of the mean is approximately normal if certain conditions are met, with a mean of 125 and a standard deviation (standard error) of 4 in the given example.
- 🎯 To find the probability of obtaining a sample mean, we standardize the sample mean by subtracting the population mean and dividing by the standard error.
- 🔢 In the example, a sample mean of 135 is 2.5 standard deviations above the population mean, indicating an unlikely event if the population mean is truly 125.
- 📈 The probability of observing a sample mean of 135 or higher, given a population mean of 125, is approximately 0.6% or 6 in 1,000.
- 🚦 The concept of hypothesis testing involves starting with a null hypothesis (H0) that the population parameter is equal to a hypothesized value, and an alternative hypothesis that it is different.
- 🔄 When testing hypotheses, if smoking does not increase blood pressure, we expect the sample mean to be around 125, but if it's higher, it challenges the null hypothesis.
- 💭 The p-value is the probability of observing a result as extreme as, or more extreme than, the observed sample mean, assuming the null hypothesis is true.
- 📊 In hypothesis testing, the t-distribution is used instead of the Z distribution when the population standard deviation is unknown, and the sample size is small.
- 🔍 The foundation for hypothesis testing is laid by calculating the p-value and comparing it to a significance level to determine whether to reject the null hypothesis.
- 📚 Further videos will expand on hypothesis testing, including more formal labeling and explanation of the components involved in the process.
Q & A
What is the main topic of the video?
-The main topic of the video is how the sampling distribution is used to build up a hypothesis test for a single numeric variable.
What are the conditions for the sampling distribution of the mean to be approximately normal?
-The sampling distribution of the mean is approximately normal as long as a few conditions are met, including having a sufficiently large sample size.
What is the population mean and standard deviation given in the example?
-In the example, the population mean is 125 and the standard deviation is 20.
What is the standard error of the mean in this context?
-The standard error of the mean is the standard deviation of the sampling distribution of the mean, which is 4 in this context (20 divided by the square root of 25).
What is the probability of obtaining a sample mean greater than or equal to 135 from a sample of 25 observations?
-The probability of obtaining a sample mean greater than or equal to 135 from a sample of 25 observations is approximately 0.6% or six in a thousand.
How is the concept of the sampling distribution used in hypothesis testing?
-The concept of the sampling distribution is used in hypothesis testing to determine the probability of observing sample data given a null hypothesis about the population parameters.
What is the null hypothesis (H0) in the context of the video?
-The null hypothesis (H0) is that the mean systolic blood pressure for smokers is the same as the mean for a healthy population, which is hypothesized to be 125.
What is the alternative hypothesis in this context?
-The alternative hypothesis is that the mean systolic blood pressure for smokers is greater than 125.
Why is the t-distribution used instead of the Z distribution in this scenario?
-The t-distribution is used instead of the Z distribution because the population standard deviation is unknown, and an estimate of it is used instead, making the t-distribution more appropriate for samples.
What does the p-value represent in hypothesis testing?
-The p-value represents the probability of observing the sample data or something more extreme, assuming the null hypothesis is true.
How does the video relate the concept of standardizing to unit conversion?
-The video relates the concept of standardizing to unit conversion by explaining that it allows us to compare estimates in terms of standard deviations rather than in the original units of measurement, such as blood pressure.
Outlines
📊 Understanding Sampling Distribution and Hypothesis Testing
This paragraph introduces the concept of the sampling distribution and its role in hypothesis testing, specifically for a single numeric variable. It explains how the sampling distribution of the mean is approximately normal if certain conditions are met, with a mean of 125 and a standard deviation (standard error) of 4. The discussion includes an example of calculating the probability of obtaining a sample mean of 135 or higher from a sample of 25 observations, given a known population mean and standard deviation. The process of standardizing the sample mean and finding the corresponding probability (0.06 or 6 in 1,000) is detailed, setting the stage for further exploration of hypothesis testing in subsequent content.
🚬 Hypothesis Testing with Smokers' Blood Pressure Data
The second paragraph delves into the application of hypothesis testing using the context of smokers' systolic blood pressure. It posits that smokers' mean blood pressure is expected to be higher than the general population's mean of 125. The paragraph outlines the process of taking a sample from a population of smokers, calculating the sample mean, and using this data to test the null hypothesis that smokers' mean blood pressure is the same as the healthy population's. The concept of alternative hypothesis is introduced, suggesting that the smokers' mean is greater than 125. The paragraph explains the foundational steps of hypothesis testing, including the calculation of the p-value, and hints at further elaboration in future videos. It concludes with a playful comparison of the beauty of physics to that of a unicorn and the enjoyment of statistics to a fun apple menu.
Mindmap
Keywords
💡Sampling Distribution
💡Standard Error
💡Hypothesis Testing
💡Population Mean
💡Sample Mean
💡Standard Deviation
💡Z-Score
💡P-Value
💡Null Hypothesis (H0)
💡Alternative Hypothesis (Ha)
💡Statistical Significance
Highlights
The video discusses the use of the sampling distribution in building a hypothesis test for a single numeric variable.
The sampling distribution is used to determine the probability of certain outcomes when a sample of data is collected, given the true population parameters.
An example is provided where the population systolic blood pressure is skewed with a mean of 125 and a standard deviation of 20.
The sampling distribution of the mean is approximately normal if certain conditions are met, with a mean of 125 and a standard deviation (standard error) of 4.
The probability of obtaining a sample mean greater than or equal to 135 from a sample of 25 observations is calculated.
The process of standardizing the sample mean is explained, which involves calculating how many standard deviations it is from the population mean.
A z-score of 2.5 is found for a sample mean of 135, indicating it is two and a half standard deviations above the population mean.
The area under the standard normal curve above a z-score of 2.5 is approximately 0.006 or 0.6%.
The concept of hypothesis testing is introduced, with a focus on reversing the direction of the inquiry from population to sample data.
A hypothetical scenario is presented where the mean systolic blood pressure for smokers is expected to be higher than the mean for a healthy population.
The null hypothesis (H0) is defined as the mean for smokers being the same as the healthy population, while the alternative hypothesis suggests it is greater than 125.
The process of hypothesis testing is outlined, starting with the null hypothesis and using the sample data to potentially reject it in favor of the alternative.
The p-value is introduced as the probability of observing the sample data if the null hypothesis is true, and it is calculated to be approximately 0.6% in this case.
The video mentions that the p-value will be further explained and used in more detail in subsequent videos.
The T-distribution is briefly mentioned as being used instead of the Z-distribution when the population standard deviation is unknown.
The video concludes by emphasizing the foundational aspects of hypothesis testing covered and the intention to expand on these concepts later.
The speaker humorously compares the beauty of physics to a unicorn and the fun of statistics to a couponing nice fun apple menu.
Transcripts
Browse More Related Video
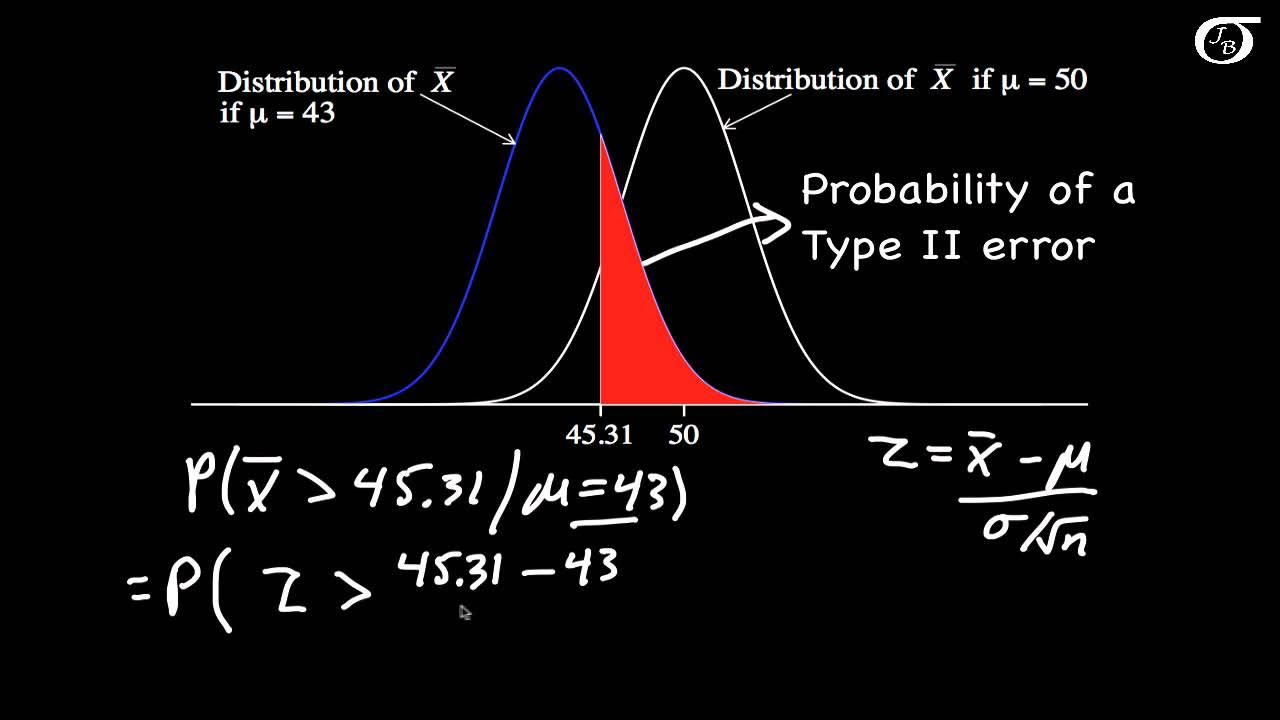
Calculating Power and the Probability of a Type II Error (A One-Tailed Example)

P-values and significance tests | AP Statistics | Khan Academy
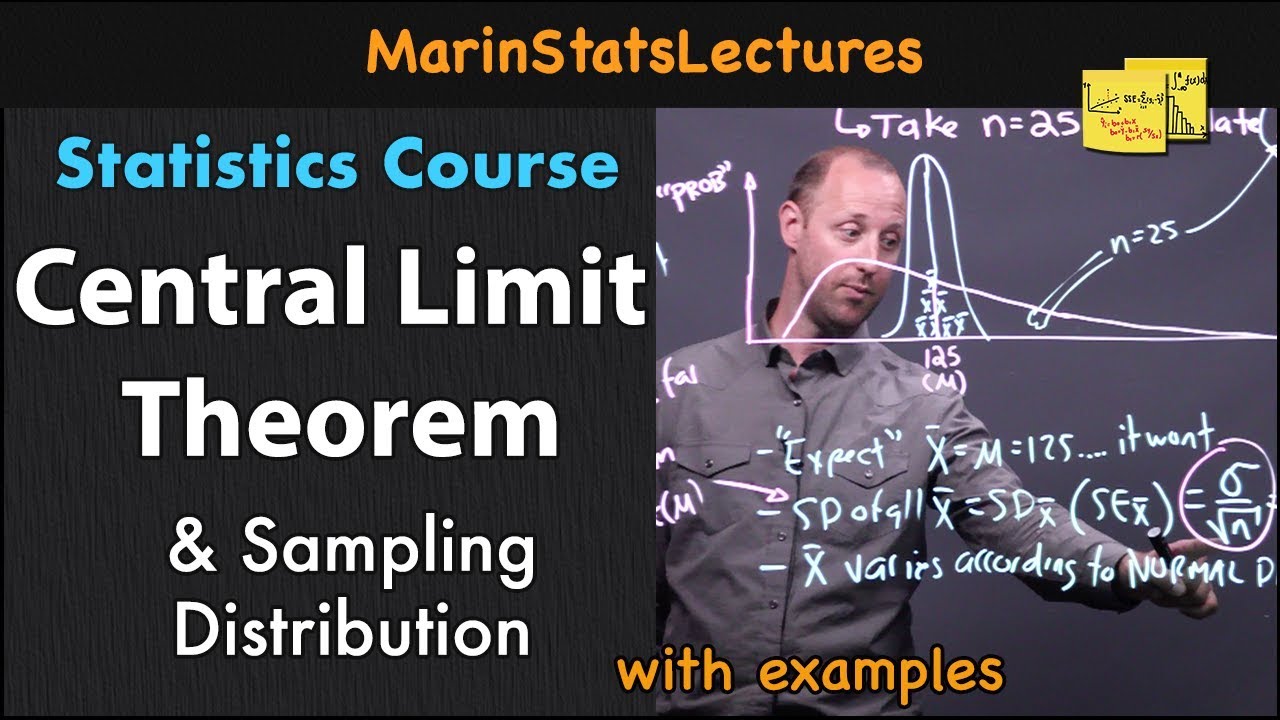
Central Limit Theorem & Sampling Distribution Concepts | Statistics Tutorial | MarinStatsLectures
8.3.2 Testing a Claim About a Mean - Sigma Known and When the Sampling Distribution Isn't Normal
Type 1 errors | Inferential statistics | Probability and Statistics | Khan Academy

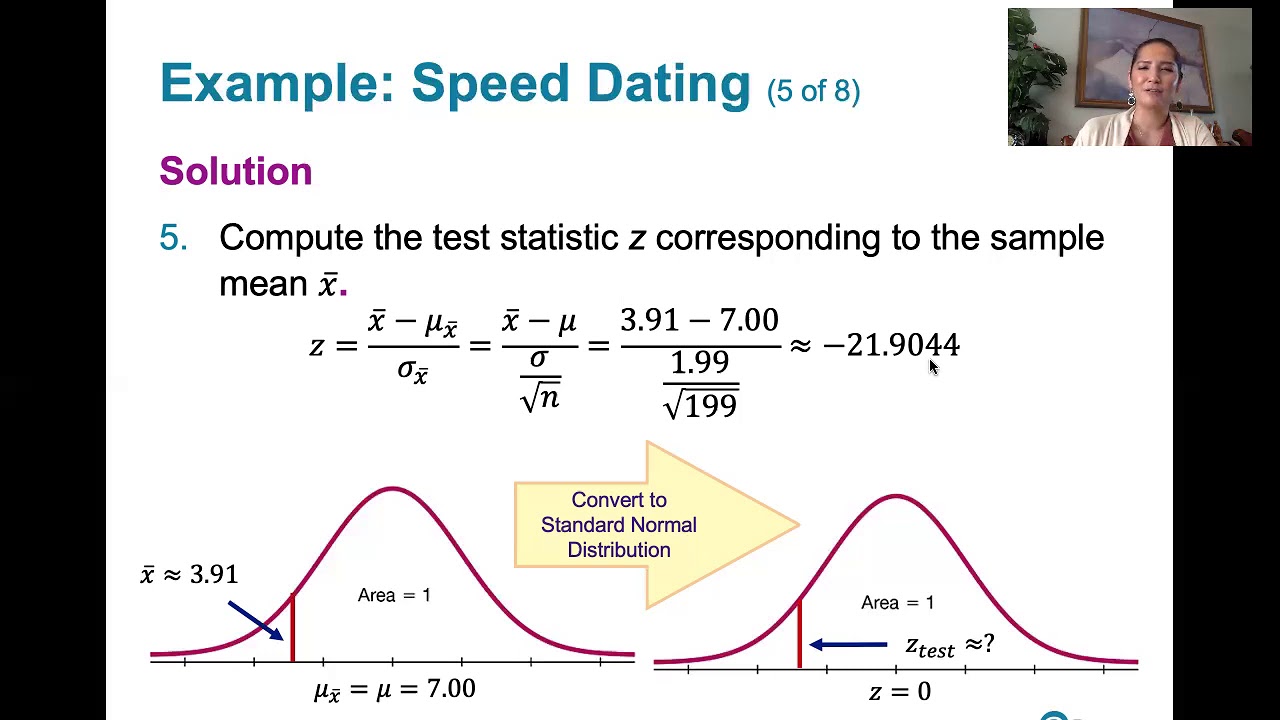
Explaining The One-Sample t-Test
5.0 / 5 (0 votes)
Thanks for rating: