8.3.2 Testing a Claim About a Mean - Sigma Known and When the Sampling Distribution Isn't Normal
TLDRThis video script covers the process of testing a claim about a population mean when the standard deviation is known, particularly when the sample size is less than 30 and the population isn't normally distributed. It explains the use of the z-score formula to determine how many standard deviations a sample mean is from the population mean, and how to use p-values and critical values for hypothesis testing. The example of female attractiveness ratings in speed dating illustrates the application of these concepts, leading to the rejection of the null hypothesis that the mean rating is 7.00. The script also briefly mentions alternative methods like bootstrap resampling, sign test, and Wilcoxon signed-rank test for non-normal distributions or small samples.
Takeaways
- 📚 The video discusses learning outcome number two from lesson 8.3, focusing on testing a claim about a mean when the population standard deviation is known.
- 🔍 It addresses how to handle situations where the sample size is less than 30 and the population is not normally distributed.
- 📉 The video provides options for testing claims about a mean in special cases, such as when the population standard deviation is known and the sample size is small.
- 📉 The test statistic used in this context is 'z' from the standard normal distribution, contrasting with the student t distribution used when the standard deviation is unknown.
- 🔢 The formula for calculating the z-score is given, which involves subtracting the population mean from the sample mean and dividing by the standard deviation of the sample means.
- 📊 The example provided involves female daters' attractiveness ratings of men in a speed dating scenario, with a sample size of 199 and a sample mean of 3.91.
- ⚖️ The significance level used in the example is 0.01, and the claim is that the population mean of such ratings is less than seven, assuming a known population standard deviation of 1.99.
- 📉 The video explains the process of checking the requirements for the test, stating hypotheses, and identifying key information for computing the test statistic.
- 📊 The z-score for the example is calculated to be -21.9044, indicating a sample mean significantly lower than the assumed population mean.
- 🔑 The p-value method and critical value method are both discussed as ways to make a decision about the null hypothesis, with the p-value being extremely small in the example.
- 🚫 The video concludes by rejecting the null hypothesis, supporting the claim that the mean rating is less than 7.00, and briefly mentions alternative methods for testing means in non-normal distributions or small sample sizes.
Q & A
What is the main topic discussed in this video?
-The video discusses learning outcome number two from lesson 8.3, which is about testing a claim about a mean when the population standard deviation is known, especially in cases where the sample size is less than 30 and the original population is not normally distributed.
What statistical test is used when the population standard deviation is known?
-When the population standard deviation is known, the Z-test from the standard normal distribution is used instead of the Student's t-test.
What is the formula used to convert the sample mean to the corresponding z-score?
-The formula used is (x̄ - μ) / (σ / √n), where x̄ is the sample mean, μ is the population mean assumed in the null hypothesis, σ is the population standard deviation, and n is the sample size.
How do you determine if the sample mean is significantly low given the null hypothesis?
-By converting the sample mean to a z-score using the formula and then comparing this z-score to the critical values or calculating the p-value to determine if it falls in the rejection region.
What were the summary statistics provided in the example problem?
-The summary statistics were: sample size (n) = 199, sample mean (x̄) = 3.91, sample standard deviation = 0.53, and the population standard deviation = 1.99.
What is the null hypothesis for the example problem?
-The null hypothesis (H0) is that the population mean (μ) is equal to 7.00.
What is the alternative hypothesis for the example problem?
-The alternative hypothesis (H1) is that the population mean (μ) is less than 7.00.
How do you find the p-value for the test statistic?
-The p-value is found using the z-score from the standard normal distribution, either by using a z-table or technology like Excel.
What was the z-score calculated for the sample mean in the example problem?
-The z-score calculated was -21.9044, indicating that the sample mean was significantly lower than the population mean under the null hypothesis.
What conclusion was drawn from the p-value in the example problem?
-Since the p-value was extremely small (much less than 0.01), the null hypothesis was rejected, supporting the claim that the population mean of attractiveness ratings is less than 7.00.
What other options are available if the population is not normally distributed and the sample size is small?
-Options include bootstrap resampling (covered in section 7.4 of the textbook) and the sign test or Wilcoxon signed-rank test (covered in section 13.2 of another textbook by Mr. Triola).
Outlines
🔍 Hypothesis Testing for Mean with Known Population Standard Deviation
This paragraph introduces the concept of testing a claim about a mean when the population standard deviation is known, especially in cases where the sample size is less than 30 and the population is not normally distributed. The speaker explains that despite these conditions, there are methods to test claims about the mean, using a different test statistic, 'z', from the standard normal distribution rather than the Student's t distribution. The formula for calculating the z-score is provided, which involves subtracting the population mean from the sample mean and dividing by the standard deviation of the sample means. The paragraph also outlines how to find p-values using z-scores and emphasizes the importance of checking the requirements for hypothesis testing before proceeding with the example of female attractiveness ratings in speed dating.
📊 Converting Sample Mean to z-Score for Hypothesis Testing
The speaker continues the discussion on hypothesis testing by demonstrating how to convert a sample mean into a z-score when the population standard deviation is known. The example involves the attractiveness ratings of men by female speed daters, with a sample size of 199, a sample mean of 3.91, and a sample standard deviation of 0.53. The null hypothesis is that the true population mean is 7.00, and the test is to determine if the sample mean is significantly lower than this value. The z-score calculation is detailed, resulting in a z-score of -21.9044, indicating that the sample mean is extremely low relative to the assumed population mean. The paragraph also explains the process of using p-values and critical values to make a decision about the null hypothesis, identifying this as a left-tailed test due to the 'less than' alternative hypothesis.
📉 Interpreting the z-Score and Making a Statistical Decision
The speaker interprets the calculated z-score of -21.9044, emphasizing its extreme deviation from the mean, indicating a very low sample mean compared to the hypothesized population mean. The explanation of how to find the p-value using both a z-table and Excel is provided, with the p-value being extremely small (1.179 × 10^-106), suggesting that obtaining a sample mean as low as 3.91 is highly unlikely if the null hypothesis were true. The paragraph discusses the decision-making process for the null hypothesis, using both the p-value method and the critical value method, ultimately leading to the rejection of the null hypothesis due to the significant evidence against it.
🚫 Addressing Non-Normal Distributions and Small Sample Sizes
The speaker acknowledges situations where the population is not normally distributed and the sample size is less than or equal to 30, and provides alternative options for testing claims about the mean. The paragraph briefly mentions bootstrap resampling and sign tests as methods that can be used in such cases, referring to additional resources for more detailed information. The speaker emphasizes that while these methods are not covered in the current course, they are important to be aware of and can be found in other sections of the textbook or in another book by the same author.
🔚 Conclusion and Transition to Future Lessons
The speaker concludes the lesson on hypothesis testing for a mean with a known population standard deviation and provides a transition to future lessons. The conclusion emphasizes the rejection of the null hypothesis in the given example, supporting the claim that the mean rating is less than 7.00. The speaker also mentions that the next lessons will cover hypothesis tests about more than one proportion or more than one mean in chapter nine, indicating a continuation of the statistical topics.
Mindmap
Keywords
💡Claim
💡Population Standard Deviation
💡Sample Size
💡Normal Distribution
💡Test Statistic
💡Z-Score
💡P-Value
💡Significance Level
💡Null Hypothesis
💡Alternative Hypothesis
💡Bootstrap Resampling
💡Sign Test
💡Wilcoxon Signed Rank Test
Highlights
The video discusses learning outcome number two from lesson 8.3, focusing on testing a claim about a mean when the population standard deviation is known.
It addresses how to handle situations where the sample size is less than 30 and the original population is not normally distributed.
The video provides options for testing claims about a mean in special cases where the standard deviation is known.
A different test statistic, z, from the standard normal distribution, is used instead of the Student t distribution when the population standard deviation is known.
The formula for converting the sample mean to the corresponding z-score is explained in detail.
The use of z-scores to determine how many standard deviations above or below the mean the sample mean lies is discussed.
The method for finding p-values associated with the z-score using a standard normal distribution table or technology is described.
An example involving female daters' attractiveness ratings of men in speed dating is used to illustrate the process.
The example includes a sample size of 199, a sample mean of 3.91, and a sample standard deviation of 0.53.
A significance level of 0.01 is used to test the claim that the population mean of such ratings is less than seven, assuming a known population standard deviation of 1.99.
The requirements for using the method, including a simple random sample and an approximately normal sampling distribution, are checked.
The null and alternative hypotheses are stated in symbolic form based on the problem statement.
The process of converting the sample mean to a z-score to determine its significance is detailed.
The calculated z-score of -21.9044 indicates a sample mean significantly lower than the assumed population mean.
The p-value method and critical value method are explained for making a decision about the null hypothesis.
The p-value is found to be extremely small, leading to the rejection of the null hypothesis.
The critical value method also leads to the rejection of the null hypothesis due to the test statistic being far into the left tail.
Alternative methods for testing a claim about a mean in non-normally distributed populations or with small sample sizes are briefly mentioned.
The conclusion supports the claim that the mean rating of females for their speed dating partners is less than 7.00.
The video concludes with a summary of the lesson and a preview of the next topic on hypothesis tests about more than one proportion or mean.
Transcripts
Browse More Related Video
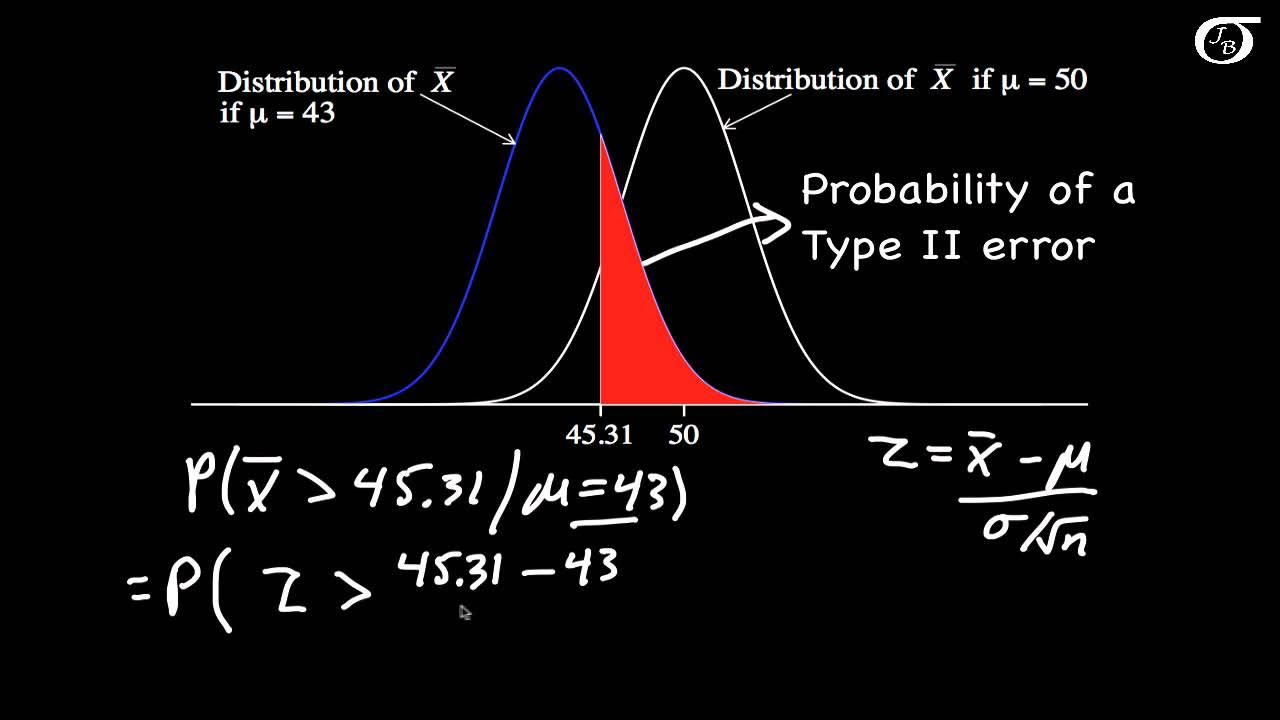
Calculating Power and the Probability of a Type II Error (A One-Tailed Example)
Hypothesis Testing Explained | Statistics Tutorial | MarinStatsLectures
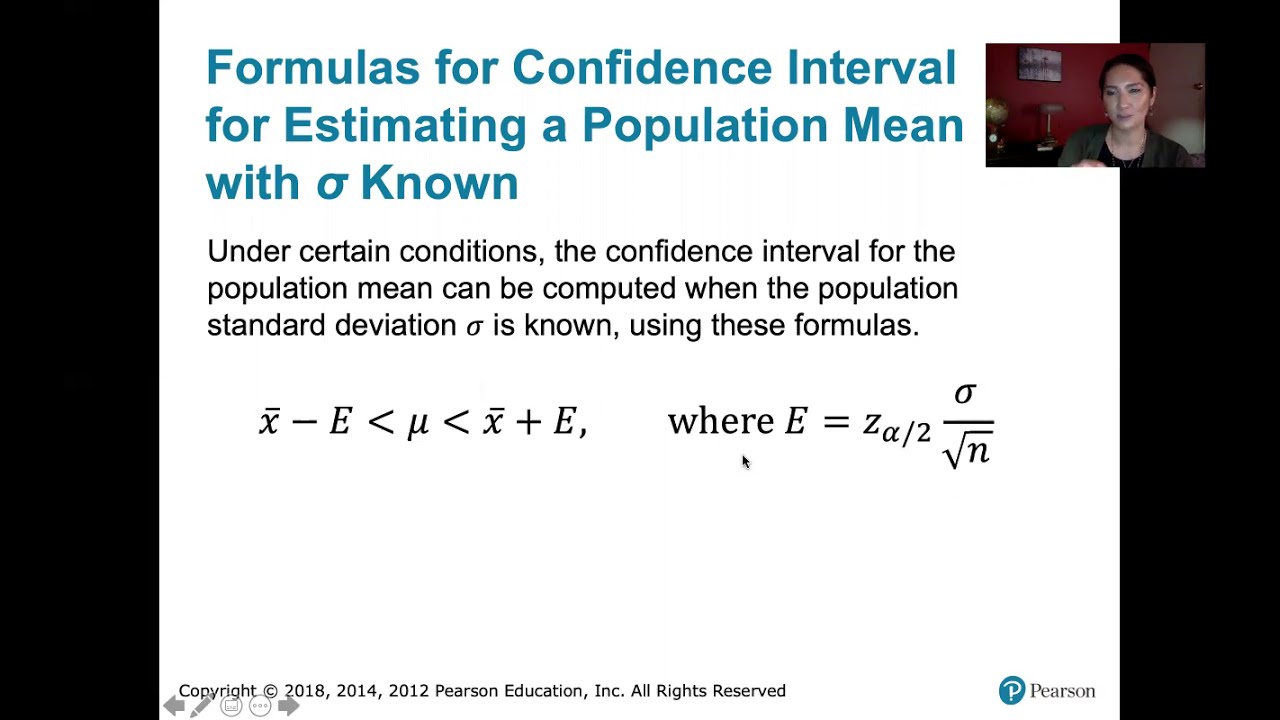
7.2.5 Estimating a Population Mean - Confidence Intervals with Known Pop. Standard Deviation
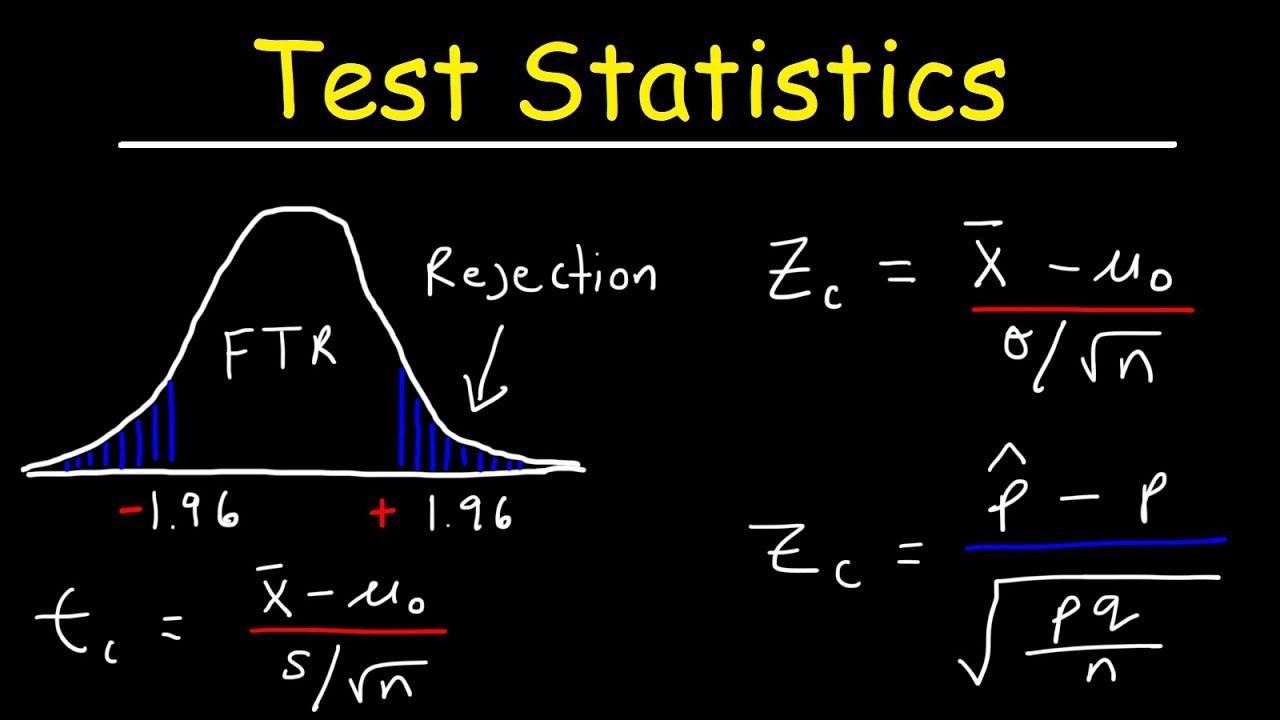
Test Statistic For Means and Population Proportions
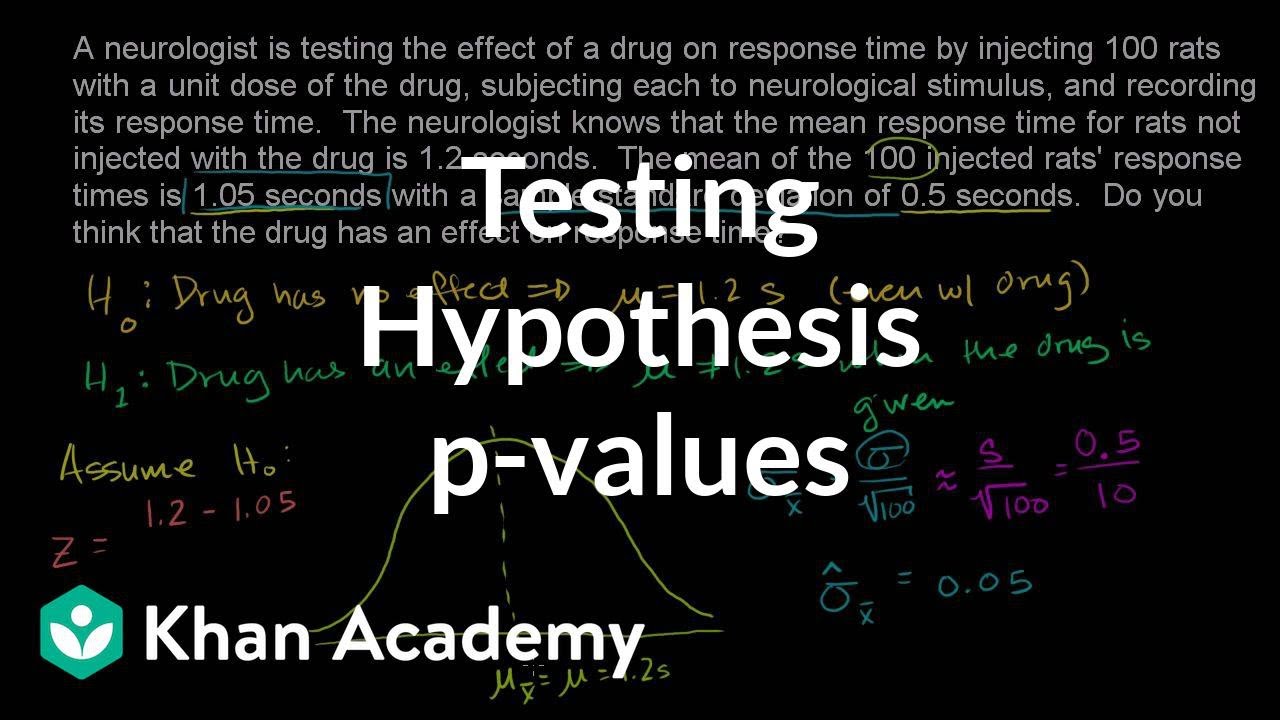
Hypothesis testing and p-values | Inferential statistics | Probability and Statistics | Khan Academy
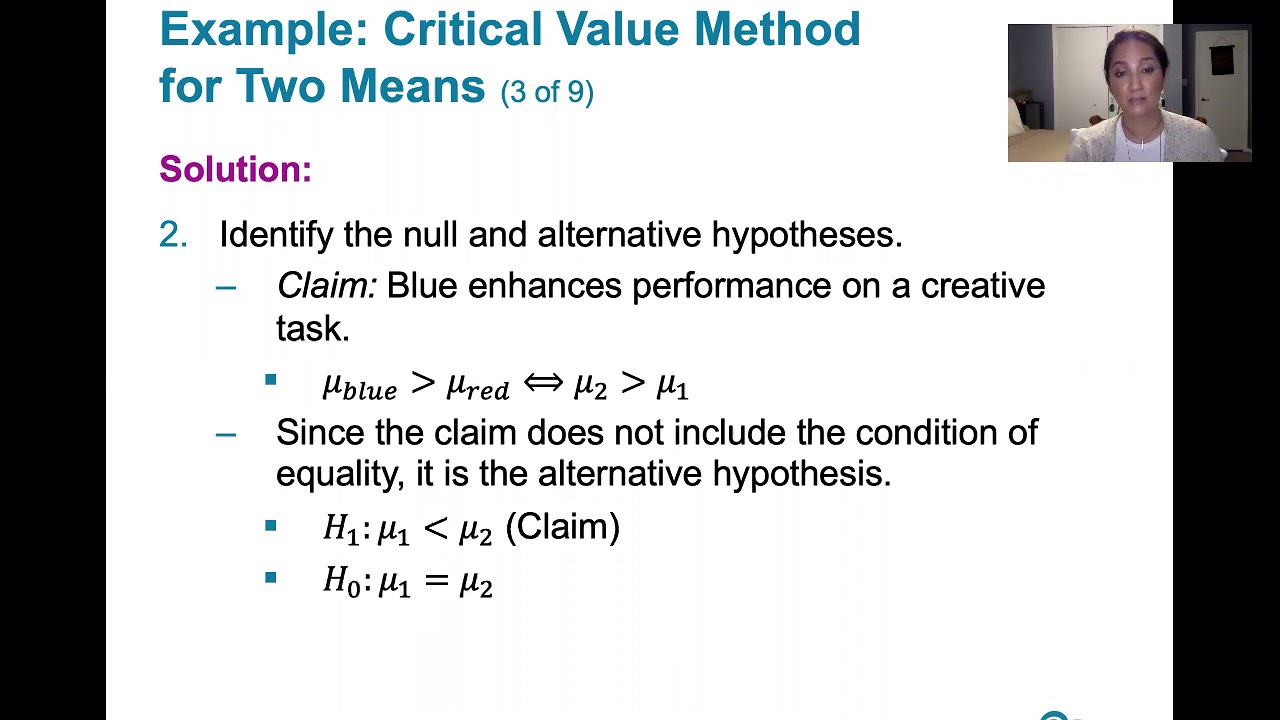
9.2.3 Two Means, Indep. Samples - Critical Value Method, St. Deviations Unknown, Not Assumed Equal
5.0 / 5 (0 votes)
Thanks for rating: