P-values and significance tests | AP Statistics | Khan Academy
TLDRThe video script discusses the use of significance tests to determine whether a change, such as altering the background color of a website to yellow, has the intended effect of increasing the time users spend on the site. The process involves setting up a null hypothesis (no effect, mean time remains 20 minutes) and an alternative hypothesis (mean time increases). A significance level, typically 1%, 5%, or 10%, is chosen to help decide whether the observed results are statistically significant. A sample is taken, and statistics such as the sample mean and standard deviation are calculated. The p-value, representing the probability of obtaining the sample statistics if the null hypothesis were true, is then computed. If the p-value is less than the significance level, the null hypothesis is rejected, indicating evidence for the alternative hypothesis. Conversely, if the p-value is higher, the null hypothesis is not rejected, suggesting the change did not significantly affect the outcome. The script emphasizes that the p-value is not the probability that the null hypothesis is true, but rather the probability of the sample results under the assumption of the null hypothesis being true.
Takeaways
- 🌐 **Background Color Change Impact**: The speaker is considering changing the website's background color from off-white to yellow to increase user engagement and time spent on the site.
- 📊 **Hypothesis Setting**: To test the impact of the color change, hypotheses are set up: a null hypothesis stating no effect on time spent, and an alternative hypothesis suggesting an increase in time spent.
- 🎯 **Significance Level**: A significance level (Alpha) is chosen to determine the threshold for statistical evidence; in this case, it's set at 0.05 or 5%.
- 🔢 **Sample Statistics**: A sample of users is taken after the color change, and sample statistics such as mean and standard deviation are calculated.
- 🤔 **P-Value Calculation**: The p-value, or probability value, is calculated to determine the likelihood of the observed sample statistics under the null hypothesis.
- 🔁 **Null Hypothesis Rejection**: If the p-value is less than the significance level (0.05), the null hypothesis is rejected, indicating evidence for the alternative hypothesis.
- ✅ **No Effect Scenario**: If the p-value is greater than or equal to the significance level, the null hypothesis is not rejected, suggesting no significant change due to the color change.
- 🚫 **Avoiding Confusion**: It's clarified that the p-value is not the probability that the null hypothesis is true, but rather the probability of observing the sample results if the null hypothesis were true.
- 🔮 **Conditional Probability**: The p-value is a conditional probability that depends on the assumption that the null hypothesis is true.
- 📚 **Sampling Distribution**: It's assumed that the sampling distribution of the sample means is normal, which allows for the use of statistical tests like t-statistics.
- 📈 **Evidence for Change**: A low p-value (e.g., 0.03) suggests that the color change has had a statistically significant effect on the time users spend on the website.
- 📉 **No Evidence for Change**: A high p-value (e.g., 0.5) indicates that the observed results could reasonably occur even if the null hypothesis were true, providing no evidence for the alternative hypothesis.
Q & A
What is the purpose of changing the website's background color to yellow in this scenario?
-The purpose of changing the website's background color to yellow is to potentially increase the amount of time that visitors spend on the website.
What are the two types of hypotheses typically set up when conducting a significance test?
-The two types of hypotheses are the null hypothesis, which assumes that the change has no effect, and the alternative hypothesis, which assumes that the change has a positive effect on the outcome.
What is the null hypothesis in the context of this website background color change?
-The null hypothesis states that changing the background color to yellow does not affect the mean time spent on the website, and it remains equal to 20 minutes.
What does the alternative hypothesis suggest in this scenario?
-The alternative hypothesis suggests that the mean time spent on the website is greater than 20 minutes after the change to a yellow background.
What is the significance level, and how is it denoted?
-The significance level is a threshold that determines when the null hypothesis should be rejected. It is usually denoted by the Greek letter Alpha (α).
Why is the sample size important when taking a sample for a significance test?
-The sample size is important because it affects the reliability of the sample statistics, such as the sample mean and standard deviation, which are used to calculate the p-value and make decisions about the null hypothesis.
What is a p-value, and how is it used in the context of a significance test?
-The p-value, or probability value, is the probability of obtaining a sample statistic as extreme as, or more extreme than, the one calculated from the sample, assuming the null hypothesis is true. It is used to decide whether to reject the null hypothesis based on the significance level.
What is the process of calculating the p-value in a significance test?
-The process involves assuming the null hypothesis is true, using the sample mean, sample size, and sample standard deviation to calculate the probability of obtaining the sample statistics. This is often done using a t-statistic if the population standard deviation is unknown.
What does it mean to reject the null hypothesis in a significance test?
-Rejecting the null hypothesis means that the evidence suggests that the alternative hypothesis is true, and there is a statistically significant effect due to the change being tested.
What is the correct interpretation of a p-value of 0.03 in this scenario?
-A p-value of 0.03 indicates that there is a 3% probability of obtaining the sample statistics if the null hypothesis were true. Since this is less than the significance level of 0.05, the null hypothesis is rejected, and there is evidence for the alternative hypothesis.
What is the difference between not rejecting the null hypothesis and accepting the null hypothesis?
-Not rejecting the null hypothesis means that there is not enough evidence to suggest the alternative hypothesis is true, given the significance level. It does not mean that the null hypothesis is definitively true; rather, it means that the data are consistent with the null hypothesis.
Why is it important to clarify that the p-value is not the probability that the null hypothesis is true given the sample statistics?
-It's important because confusing the p-value with the probability of the null hypothesis being true given the sample statistics can lead to incorrect conclusions. The p-value is about the probability of the observed data under the assumption that the null hypothesis is true, not the likelihood of the null hypothesis itself.
Outlines
🌟 Significance Testing for Website Color Change
The paragraph discusses the use of significance testing to determine the impact of changing a website's background color from off-white to yellow on user engagement. The speaker outlines the process of setting up null and alternative hypotheses, where the null hypothesis assumes no change in the mean time spent on the website (20 minutes), and the alternative suggests an increase due to the color change. A significance level (Alpha) is chosen, typically 1%, 5%, or 10%, to serve as a threshold for statistical significance. The speaker explains that by taking a sample of users after the change and calculating statistics such as the sample mean and standard deviation, one can calculate a p-value. This p-value represents the probability of obtaining the sample statistics assuming the null hypothesis is true. If the p-value is less than the significance level, the null hypothesis is rejected in favor of the alternative, suggesting the color change had the intended effect. The paragraph emphasizes the importance of understanding the p-value as a conditional probability and not a measure of the null hypothesis's truth.
📊 Interpreting P-values and Hypothesis Testing
This paragraph delves deeper into the interpretation of p-values in the context of hypothesis testing. It clarifies that a p-value is not the probability that the null hypothesis is true given the observed data, but rather the probability of observing the sample statistics if the null hypothesis were true. The speaker uses a hypothetical example where a p-value of 0.03 (3%) leads to the rejection of the null hypothesis because it is below the significance level of 0.05 (5%). Conversely, a p-value of 0.5 indicates a 50% chance of obtaining the sample result under the null hypothesis, suggesting the result is likely even without the color change, and thus the null hypothesis is not rejected. The paragraph underscores the broad applicability of significance testing across various fields and the importance of correctly interpreting p-values in determining whether to accept or reject the null hypothesis.
Mindmap
Keywords
💡Significance tests
💡Null hypothesis
💡Alternative hypothesis
💡Significance level (Alpha)
💡Sample
💡Sample mean
💡Sample standard deviation
💡P-value
💡T-statistic
💡Conditional probability
💡Confidence in results
💡Assumptions in testing
Highlights
The speaker discusses the impact of changing a website's background color on user engagement, specifically from off-white to yellow.
A mean time of 20 minutes is identified as the current average time spent by users on the website.
The concept of significance testing is introduced to measure the effectiveness of the color change.
Null hypothesis is defined as no effect from the change, with the mean time remaining at 20 minutes.
Alternative hypothesis suggests that the mean time spent will increase due to the color change.
Significance level, denoted by Alpha, is set at 0.05 to determine the threshold for statistical significance.
A sample of 100 visitors to the new yellow background website is proposed to calculate sample statistics.
Sample mean and standard deviation are key statistics used to calculate the p-value.
P-value, or probability value, is calculated to determine if the sample statistics are likely under the null hypothesis.
If the p-value is less than the significance level, the null hypothesis is rejected in favor of the alternative.
If the p-value is equal to or greater than the significance level, the null hypothesis cannot be rejected.
The process of not rejecting the null hypothesis does not mean it is accepted, only that there is insufficient evidence against it.
A hypothetical p-value of 0.03 leads to the rejection of the null hypothesis, indicating the color change had an effect.
A hypothetical p-value of 0.5 suggests no significant change and does not lead to the rejection of the null hypothesis.
The p-value is the probability of observing the sample statistics if the null hypothesis were true, not the probability of the null hypothesis being true.
The significance test's outcome is applicable across various fields and is a fundamental concept in statistical analysis.
The importance of clarity in understanding what the p-value represents and its role in hypothesis testing is emphasized.
Transcripts
Browse More Related Video
Introduction to Type I and Type II errors | AP Statistics | Khan Academy

Statistical Significance and p-Values Explained Intuitively

What is p-value? How we decide on our confidence level.
Hypothesis testing and p-values | Inferential statistics | Probability and Statistics | Khan Academy

p-value - easily explained with an example
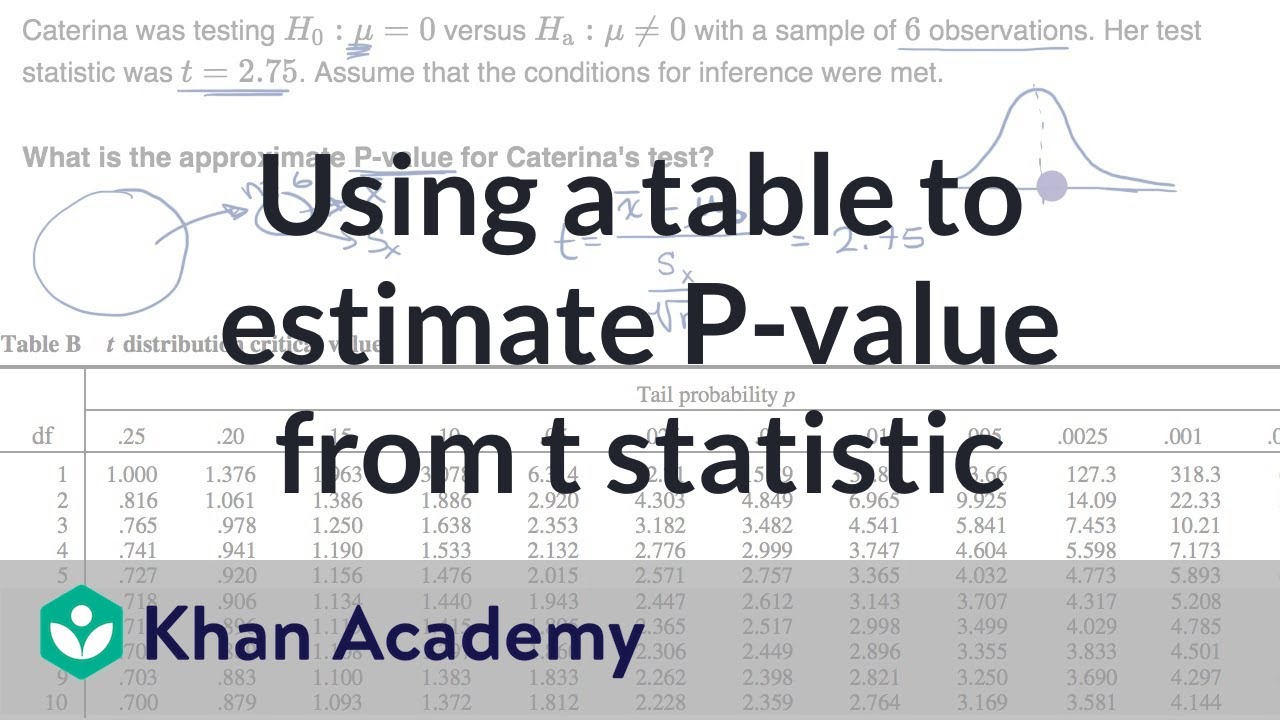
Using a table to estimate P-value from t statistic | AP Statistics | Khan Academy
5.0 / 5 (0 votes)
Thanks for rating: