Business Calculus - Math 1329 - Section 3.3 - Curve Sketching
TLDRThe video script offers an in-depth exploration of calculus concepts, focusing on the application of L'Hôpital's Rule to indeterminate forms such as 0/0 and ∞/∞. It covers the process of finding limits, derivatives, and analyzing the behavior of functions, including increasing/decreasing intervals, concavity, and inflection points. The script walks through several examples, illustrating how to sketch curves and understand the end behavior of functions. It also touches on the importance of considering the domain and vertical asymptotes in function analysis. The examples provided demonstrate the step-by-step approach to solving calculus problems, making complex mathematical concepts more accessible.
Takeaways
- 📚 L'Hôpital's Rule is a method for calculating limits that result in an indeterminate form, such as 0/0 or ∞/∞, by taking the derivative of the numerator and denominator and reevaluating the limit.
- 🔢 When applying L'Hôpital's Rule, it's important to verify that the limit is indeed in an indeterminate form and not immediately determinable through simplification.
- 📈 The end behavior of a function, which is its behavior as X approaches ∞ or -∞, can be determined by evaluating the limit of the function as X approaches these values.
- 🤔 To find the zeros of a function, set the function equal to zero and solve algebraically. The multiplicity of the root indicates whether the graph touches or crosses the x-axis.
- 📌 The first derivative of a function can determine where the function is increasing or decreasing, while the second derivative indicates concavity (whether the function is concave up or down).
- ⚪️ Inflection points, where the concavity of a function changes, can be found where the second derivative is zero or undefined and the function is defined at that point.
- 🚫 A vertical asymptote occurs when the limit of a function at a certain point does not exist because the denominator of the function approaches zero, while the numerator does not.
- 🔲 A hole in a graph occurs when the limit of a function as X approaches a certain value is a finite number, but the function itself is undefined at that point.
- 🏁 A horizontal asymptote is a horizontal line that the graph of a function approaches as X approaches ∞ or -∞. It occurs when the ratio of the leading coefficients of the numerator and denominator is a constant.
- ✏️ When sketching a graph of a function, it's helpful to consider all the information about the function's behavior, including zeros, asymptotes, increasing/decreasing intervals, and concavity.
- 📉 If the first derivative of a function is always negative and the function is not defined at certain points, the function is decreasing over its entire domain, with no relative extrema.
Q & A
What is L'Hôpital's Rule used for in the context of limits?
-L'Hôpital's Rule is used to find the limit of a fraction where the numerator and denominator both approach zero or infinity, resulting in an indeterminate form such as 0/0 or ∞/∞. It states that the limit of the fraction as x approaches a certain value is equal to the limit of the derivative of the numerator divided by the derivative of the denominator as x approaches that value.
How does the end behavior of a graph relate to the limit as x approaches infinity?
-The end behavior of a graph refers to what the graph does on the left and right sides as it extends to infinity. When evaluating the limit as x approaches positive or negative infinity, you're looking at this end behavior to determine if the function approaches a certain value, increases without bound, or oscillates.
What is the significance of a function having a zero at a certain point?
-A zero of a function is a value of x for which the function equals zero. It represents an x-intercept of the graph of the function, indicating where the graph crosses the x-axis. The multiplicity of the zero can tell you whether the graph touches the x-axis and bounces back (even multiplicity) or crosses it (odd multiplicity).
How do you determine if a function is increasing or decreasing?
-To determine if a function is increasing or decreasing, you find the first derivative of the function. If the first derivative is positive over an interval, the function is increasing on that interval. If the first derivative is negative, the function is decreasing over that interval.
What does it mean for a function to have a relative maximum or minimum?
-A relative maximum or minimum is a point on the graph of a function where it reaches a higher or lower value than at nearby points. It does not necessarily mean the highest or lowest value of the function over its entire domain, but rather a local extremum.
What is the purpose of finding the concavity of a function?
-Finding the concavity of a function helps to determine the curvature of the graph. A function is concave up on intervals where its second derivative is positive and concave down where the second derivative is negative. This information can be used to identify inflection points, which are points where the concavity changes.
What is an inflection point and how do you find it?
-An inflection point is a point on the graph of a function where the concavity changes. It is found by setting the second derivative of the function to zero and solving for x. If the second derivative changes sign around a root, then there is an inflection point at that x-value.
What does it mean for a function to have a vertical asymptote?
-A vertical asymptote is a vertical line that the graph of a function approaches but never crosses. It occurs when the denominator of a rational function is zero, but the numerator is not zero at that point. The function is undefined at the asymptote, but the limit of the function as it approaches the asymptote from either side may exist.
How do you find the horizontal asymptote of a rational function?
-To find the horizontal asymptote of a rational function, you look at the degrees of the polynomials in the numerator and the denominator. If the degrees are the same, the horizontal asymptote is at y = ratio_of_the_coefficients_of_the_leading_terms. If the degree of the denominator is higher, the horizontal asymptote is y = 0. If the degree of the numerator is higher, there is no horizontal asymptote.
What is the quotient rule for derivatives?
-The quotient rule is a method used to find the derivative of a quotient of two functions. If you have a function f(x) = g(x)/h(x) where both g and h are differentiable, the derivative f'(x) is given by: f'(x) = (g'(x)h(x) - g(x)h'(x)) / (h(x))^2.
How do you determine if a function has a hole at a certain point?
-A function has a hole at a certain point if the limit of the function as x approaches that point exists and is finite, but the function is undefined at that point. This can occur when a factor in the numerator and denominator of a rational function cancel out, but the point is not in the domain of the function.
Outlines
📚 Introduction to L'Hôpital's Rule
This paragraph introduces L'Hôpital's rule, a mathematical technique for calculating limits of indeterminate forms, particularly zero over zero and infinity over infinity. The rule states that if the limit of a fraction results in an indeterminate form, it can be resolved by taking the limit of the derivatives of the numerator and denominator separately. The paragraph also provides an example to illustrate the application of L'Hôpital's rule.
🔍 Applying L'Hôpital's Rule to Infinity
This section focuses on the application of L'Hôpital's rule to limits involving infinity. It explains that when the limit of a function as X approaches infinity results in an indeterminate form of infinity over infinity, L'Hôpital's rule can be applied by taking the limit of the derivatives of the numerator and denominator. The paragraph includes examples that demonstrate how to use the rule for polynomial functions and how it can be applied multiple times until the indeterminate form is resolved.
📈 Analyzing Function Behavior
The paragraph discusses the process of analyzing a function's behavior by finding its zeros, intervals of increase and decrease, concavity, and inflection points. It uses the function f(X) = X^3 - 6X^2 as an example, showing how to find the zeros by setting the function equal to zero and factoring, and how to use the multiplicity of the roots to determine whether the graph crosses or touches the x-axis. The paragraph also covers finding intervals of increase and decrease by analyzing the sign changes of the first derivative.
📉 Determining Concavity and Inflection Points
This paragraph continues the analysis of the function's behavior by determining its concavity and inflection points. It explains how to find the second derivative of the function and use it to identify intervals where the function is concave up or concave down. The paragraph also describes how to find inflection points by looking for changes in concavity and provides a method to sketch the graph of the function based on the derived information.
🔗 Simplifying Rational Functions and Analyzing Asymptotes
The focus of this paragraph is on simplifying rational functions and analyzing their asymptotic behavior. It demonstrates how to factor and reduce a function to its simplest form while being mindful of the domain restrictions. The paragraph also discusses how to find vertical and horizontal asymptotes by examining the behavior of the function as X approaches certain values and infinity. The concept of holes in the graph is introduced, and the limits at excluded values are taken to determine the function's behavior.
📊 Sketching Graphs Using Derivative Information
This paragraph provides a method for sketching the graph of a function using information from its first and second derivatives. It explains how to create a sign chart for the derivatives and use it to determine the function's increasing/decreasing behavior and concavity. The paragraph emphasizes the importance of considering the function's domain and the impact of undefined values in the derivatives on the graph. It also includes an example of how to sketch a graph using the sign chart information.
🤔 Interpreting Sign Charts Without the Original Function
The paragraph presents a strategy for sketching a graph when only the sign chart information is provided, without the original function. It outlines a step-by-step approach to translating the sign chart information into a visual graph. The process involves identifying critical points, such as horizontal and vertical tangent lines, and inflection points, and using this information to deduce the overall shape and behavior of the graph. The paragraph concludes with an example that illustrates the application of this strategy.
Mindmap
Keywords
💡L'Hôpital's Rule
💡Derivative
💡Indeterminate Form
💡Vertical Asymptote
💡Horizontal Asymptote
💡Concavity
💡Inflection Point
💡Quotient Rule
💡End Behavior
💡Sign Chart
💡Multiplicity
Highlights
Introduction to sketching curbs using l'Hôpital's rule for indeterminate forms like 0/0 or ∞/∞.
L'Hôpital's rule states that the limit of a fraction as X approaches C is equal to the limit of the derivatives of the numerator and denominator.
The rule is applied to find limits of functions where direct substitution results in an indeterminate form.
Example 1 demonstrates using l'Hôpital's rule to find the limit of (x^2 - 25)/(x^2 - 5x) as x approaches 5.
Example 2 illustrates applying l'Hôpital's rule to find the limit of (3x - 4)/(7x + 9) as x approaches infinity.
Example 3 involves using l'Hôpital's rule twice to find the limit of a polynomial fraction as x approaches infinity.
In Example 4, the function f(x) = x^3 - 6x^2 is analyzed for zeros, intervals of increase/decrease, concavity, and inflection points.
The process of graphing a function using its critical points and concavity is demonstrated.
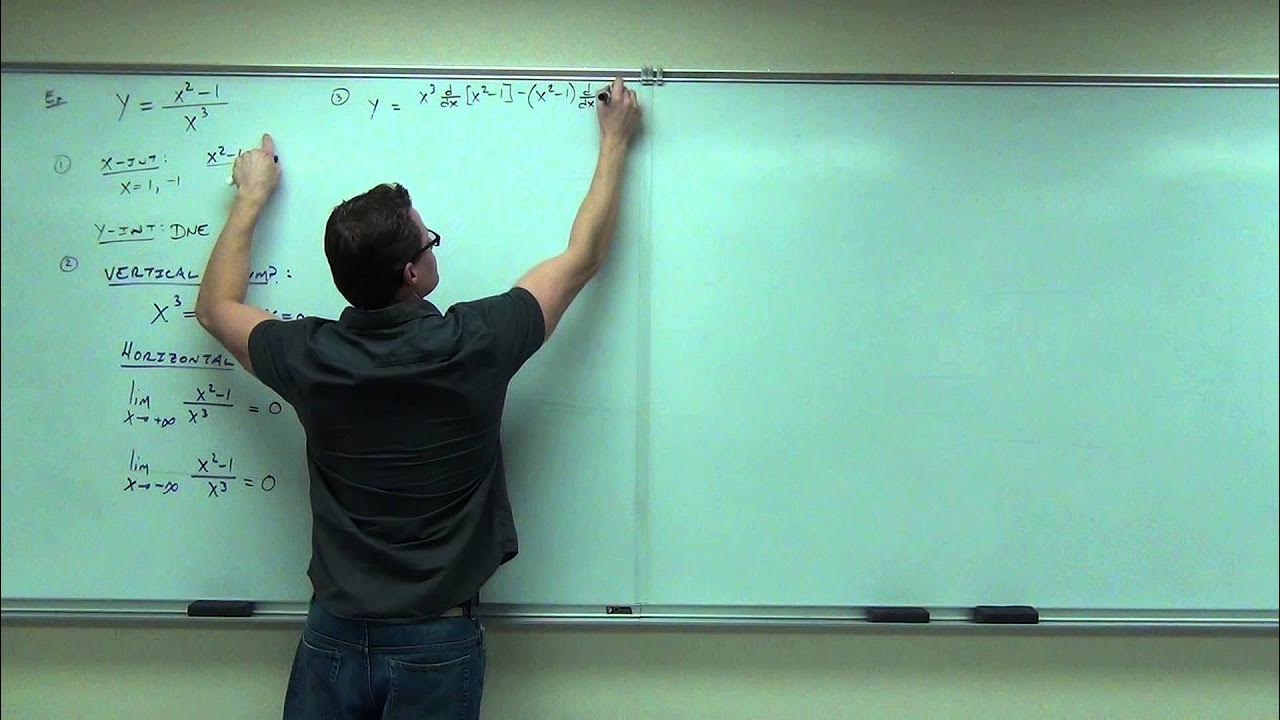
Example 5 deals with finding zeros, vertical and horizontal asymptotes, and sketching the graph of a rational function.
The concept of a hole in a function's graph is introduced when the limit exists but is not defined at a certain point.
The function's end behavior is determined by the limits as x approaches infinity and negative infinity.
Example 6 involves finding the domain, zeros, and analyzing the function for extrema and inflection points without an explicit function form.
The importance of considering the function's domain when applying l'Hôpital's rule and analyzing derivatives is emphasized.
A method for sketching a graph from sign charts and limit information is presented in Example 7.
The use of limit information to infer the presence of holes or asymptotes in a function's graph is demonstrated.
Example 8 showcases creating a possible graph of a function given its first and second derivative sign charts and limit information.
The video concludes with a complex example of graphing a function with various features such as holes, vertical asymptotes, and inflection points.
Transcripts
Browse More Related Video
Calculus 1 Lecture 3.6: How to Sketch Graphs of Functions
AP Calculus AB Review
AP Calculus AB 2012 Multiple Choice (calculator) - Questions 76 - 92
Calculus AB - Unit 1 Review

Curve Sketching - First & Second Derivatives - Graphing Rational Functions & Asymptotes - Calculus

Calculus AB Homework 3.3 The Quotient Rule
5.0 / 5 (0 votes)
Thanks for rating: