Calculus AB Homework 2.4 The Second Derivative
TLDRThis video tutorial walks through unit two's homework problems 11 to 14, focusing on the differentiation and behavior of functions. It explains how to determine if a function is increasing or decreasing by examining the first derivative, and whether it is concave up or down by analyzing the second derivative. The video also explores estimating derivatives from data points, predicting function values, and sketching graphs to visualize the function's behavior. It concludes with sketching hypothetical functions that meet specific increasing, decreasing, and concavity properties.
Takeaways
- 📚 The video discusses solving calculus homework problems related to differentiability, concavity, and estimation of derivatives and second derivatives.
- 🔍 For problem 11, the function f(x) is increasing at x = 2 because f'(2) = 1.5, which is positive.
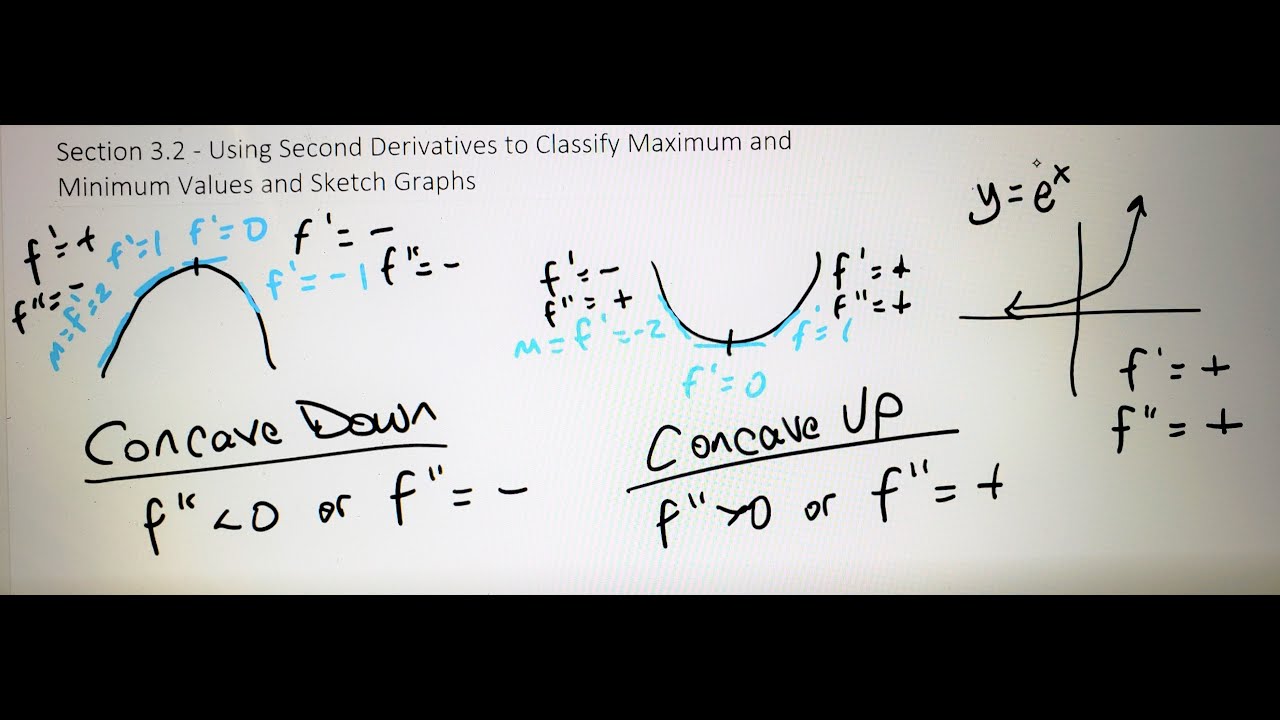
- 📉 The function f(x) is concave down at x = 2 since f''(2) = -0.25, indicating a negative second derivative.
- 🔑 The value of f(2.1) is expected to be greater than f(2) because the function is increasing at x = 2.
- 📈 The derivative f'(2.1) is expected to be less than f'(2) because the second derivative f''(2) is negative, suggesting a decreasing rate of increase.
- 📊 The video includes a sketch of the function y = f(x) and its tangent line at x = 2, illustrating the concept of tangency and slope.
- 📈 In problem 12, the slope of the tangent line to y = g(x) at x = 2 is estimated to be 1.5 by using the graph of g'(x).
- 🚫 The function g(x) has at most one real solution to g(x) = 0 because g'(x) is always positive, indicating a strictly increasing function.
- 🔄 The concavity of g(x) changes nine times between x = -3 and x = 3, determined by the behavior of g'(x).
- 🤔 The video uses a table of data to estimate derivatives and second derivatives for a bungee jumper's height over time, illustrating the concept of central differences.
- 📉 The bungee jumper's velocity is decreasing on the intervals from 0 to 2 and from 6 to 10, as indicated by the concavity of the height function H(T).
Q & A
What is the given information about the function f(x) in problem number 11?
-The function f(x) is differentiable, with f(2) = -3, f'(2) = 1.5, and f''(2) = -0.25.
Is the function f(x) increasing or decreasing at x = 2 based on the given information?
-The function f(x) is increasing at x = 2 because f'(2) = 1.5, which is greater than 0.
What does the second derivative f''(2) indicate about the concavity of the function at x = 2?
-Since f''(2) = -0.25, which is less than 0, the function is concave down at x = 2.
What can be inferred about the value of f(2.1) compared to f(2)?
-Since f(2) = -3 and the function is increasing at that point, f(2.1) is expected to be greater than -3.
Why is f'(2.1) expected to be less than 1.5?
-Because f'(2) = 1.5 and f''(2) is negative, indicating that the function's rate of increase is decreasing, so f'(2.1) should be less than 1.5.
What is the process of estimating the slope of the tangent line to y = G(x) at the point (2, G(2))?
-The slope of the tangent line at (2, G(2)) is estimated by finding the value of G' at x = 2 from the graph of G', which is approximately 1.5.
How many real number solutions can there be to the equation G(x) = 0, and why?
-There can be at most one solution because G' is always positive, indicating that G(x) is strictly increasing and can only cross the x-axis once.
How many times does the concavity of G change on the interval from -3 to 3, and how can this be determined?
-The concavity of G changes 9 times on the interval from -3 to 3. This can be determined by looking at the graph of G' and identifying where G' changes from increasing to decreasing or vice versa.
How can you estimate the value of G''(2) using the graph?
-G''(2) is estimated by drawing a tangent line to the graph of G' at x = 2 and estimating its slope, which comes out to be approximately 3.75.
What does the value of H''(5) measure in the context of the bungee jumper's motion?
-H''(5) measures the acceleration of the bungee jumper at time T = 5, as it represents the rate of change of velocity.
Based on the data, during which time intervals is the function y = H(T) concave down, and what does this imply about the velocity?
-The function y = H(T) is concave down on the intervals 0 to 2 and 6 to 10. This implies that the velocity of the bungee jumper is decreasing during these time intervals.
How can you sketch a graph for a function that satisfies the properties given in problem number 14?
-For each part of problem 14, sketch a graph that reflects the given properties of increasing/decreasing and concave up/concave down behavior. Use inflection points where the concavity changes and ensure the graph reflects the described behavior over the specified intervals.
Outlines
📚 Analysis of Function Behavior and Graph Sketching
The video discusses the behavior of a differentiable function 'f(x)' using given values at x=2, including 'F(2)', 'F' prime of 2, and 'F' double prime of 2. It determines that 'f' is increasing at x=2 due to a positive first derivative and concave down because of a negative second derivative. The video also speculates on the value of 'f' at x=2.1 and 'f' prime at x=2.1, suggesting they will be greater and less than their values at x=2, respectively, based on the function's increasing and decreasing nature. Finally, it sketches a graph of 'y=f(x)' near the point (2, 'F'(2)) and includes a tangent line with a slope of 1.5.
🔍 Derivative Analysis and Solution Count for G(x)=0
This section examines the graph of the derivative 'G' prime to determine the number of real solutions to the equation 'G(x)=0'. Since 'G' prime is always positive, indicating that 'G(x)' is strictly increasing, it concludes that there can be at most one solution to 'G(x)=0'. It also analyzes the concavity changes of 'G(x)' on the interval from -3 to 3 by looking at where 'G' prime increases or decreases, identifying nine points where concavity changes. The video estimates 'G' double prime of 2 by drawing a tangent line to 'G' prime at x=2 and calculating an approximate slope of 3.75.
📉 Estimating Velocity and Acceleration of a Bungee Jumper
The video uses a table of data to estimate the velocity ('H' prime) of a bungee jumper at times 4.5, 5, and 5.5 seconds, identifying 5.5 seconds as the time when the jumper is rising most rapidly with a velocity of 23.9 feet per second. It then estimates the acceleration ('H' double prime) at 5 seconds by calculating the change in velocity, resulting in 9.6 feet per second squared. The physical property measured by 'H' double prime is acceleration, indicating how quickly the jumper's velocity is changing.
📈 Determining Concavity and Velocity Changes from Scatterplot
The video creates a scatterplot from given data points to determine the intervals where the function 'H(T)' is concave down, which corresponds to times when the velocity is decreasing. It identifies two intervals, from 0 to 2 seconds and from 6 to 10 seconds, where the function is concave down, indicating that the velocity is decreasing during these times. The concavity changes are used to infer the behavior of the velocity of the bungee jumper.
🎨 Sketching Graphs Based on Function Properties
The final part of the video involves sketching possible graphs for functions that satisfy certain properties on the interval from -3 to 3. Four scenarios are discussed: a function that is increasing and concave up to down, another that is increasing and concave down to up, a third that is decreasing and concave up to linear to down, and the last one that is decreasing, becomes linear, and then increasing but remains concave down. Each sketch illustrates the function's behavior regarding increasing/decreasing and concave up/down properties.
Mindmap
Keywords
💡Differentiable function
💡Derivative
💡Second derivative
💡Concave up/down
💡Tangent line
💡Increasing function
💡Estimation
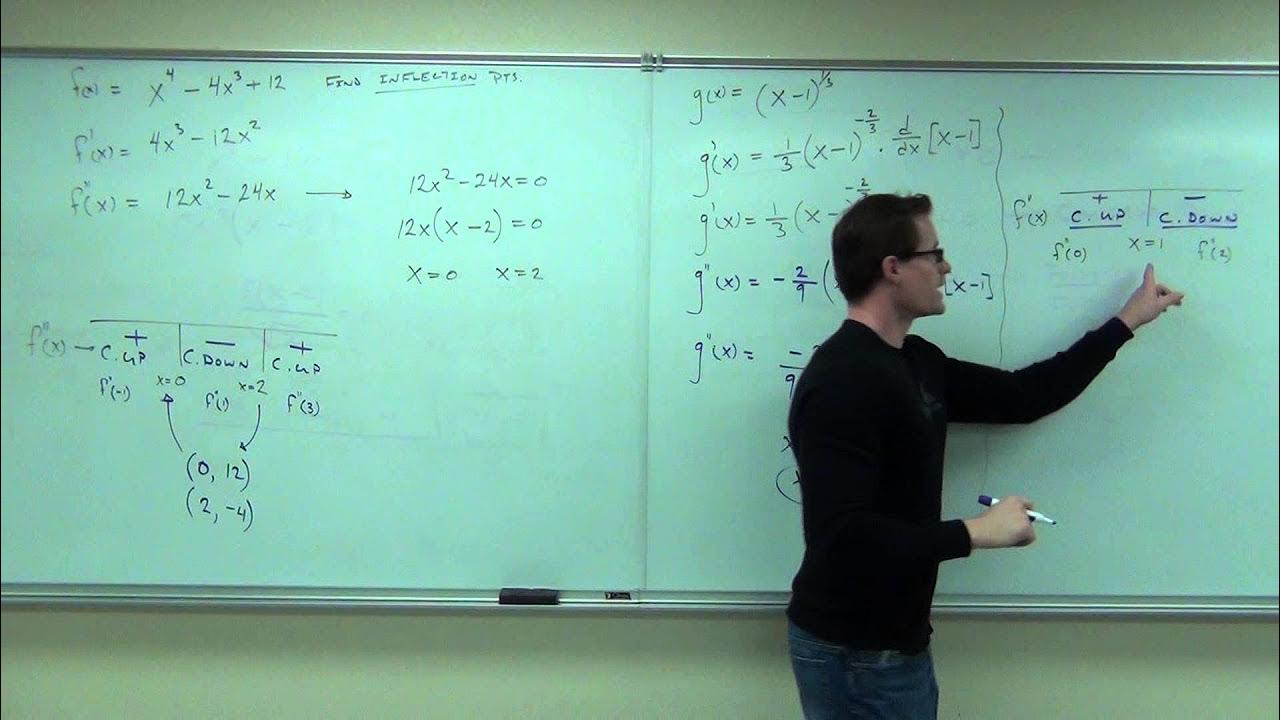
💡Inflection point
💡Concavity change
💡Acceleration
Highlights
Differentiability of function y=f(x) and its implications on increasing/decreasing nature.
Positive first derivative indicates an increasing function at a given point.
Negative second derivative suggests the function is concave down at a specific point.
Estimation of function value at a nearby point based on increasing nature.
Derivative's decreasing nature inferred from negative second derivative.
Graphical representation of function and tangent line near a specific point.
Interpretation of a graph to find the slope of a tangent line.
Analysis of the number of real number solutions to an equation based on the behavior of the derivative.
Determination of concavity changes from the derivative graph.
Estimation of second derivative from a graphical representation.
Application of data to estimate the rate of change in a bungee jumper's height over time.
Estimation of the acceleration of a bungee jumper using second derivative.
Graphical analysis to determine intervals of concavity and implications on velocity.
Sketching a function graph that satisfies specific increasing/decreasing and concave properties.
Identification of inflection points from changes in concavity.
Understanding the physical significance of the second derivative in the context of motion.
Visualizing the concavity and its relation to the velocity of a bungee jumper.
Transcripts


5.0 / 5 (0 votes)
Thanks for rating: