Math 11 - Section 3.2
TLDRThe video script provides an in-depth exploration of the role of second derivatives in classifying maximum and minimum values of functions and sketching their graphs. It begins with an analogy of driving a car to explain the concept of derivatives, with the first derivative representing speed and the second derivative representing acceleration. The script then delves into the significance of the second derivative in determining concavity, using graphical examples to illustrate how a positive second derivative indicates concave up (increasing slopes) and a negative second derivative indicates concave down (decreasing slopes). The concept of inflection points, where the concavity changes, is introduced with the help of graphical analysis. The second derivative test is explained as a method to identify relative maxima and minima by evaluating the concavity at critical points. The script also guides viewers on how to sketch graphs based on given derivative properties, emphasizing the importance of understanding the relationship between the first and second derivatives and the original function's behavior. The summary underscores the practical application of these mathematical concepts in analyzing the shape and properties of functions, encouraging viewers to practice these techniques to enhance their comprehension.
Takeaways
- 📌 The second derivative represents the rate of change of the first derivative, which can indicate acceleration in the context of velocity and position.
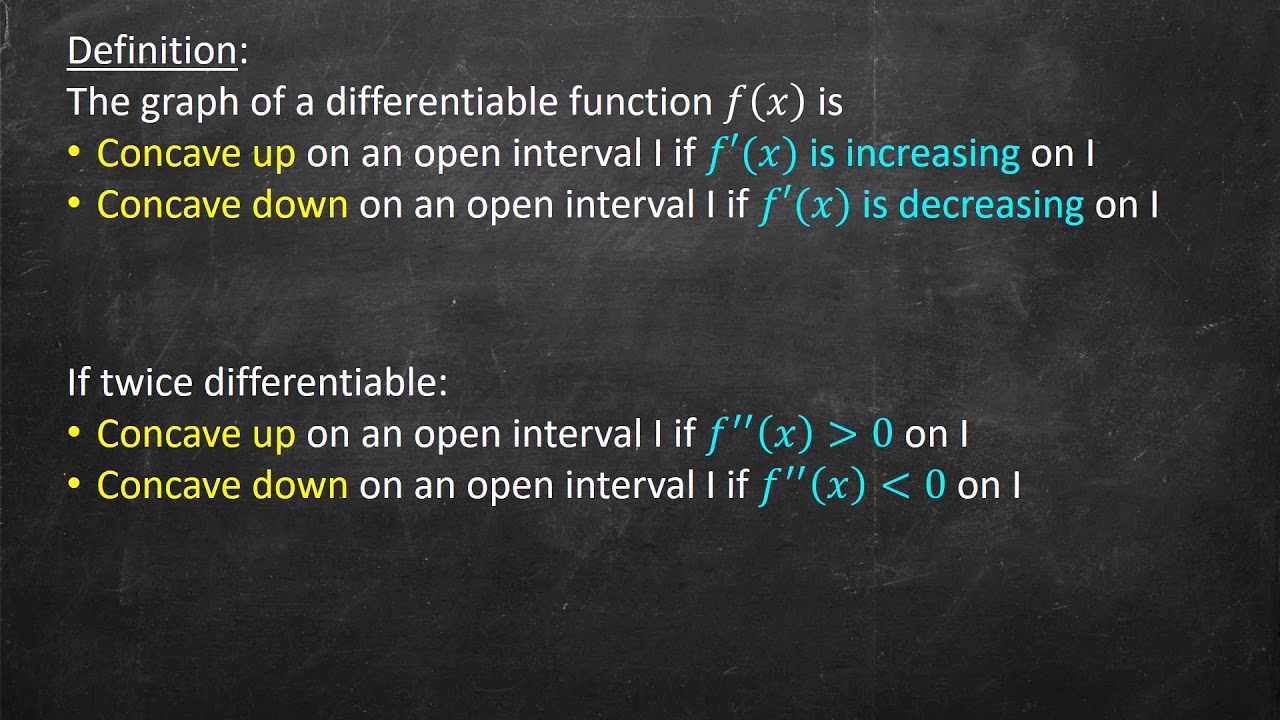
- 📈 A positive second derivative (f''(x) > 0) corresponds to a graph that is concave up, meaning the rate of change of the slope is increasing.
- 📉 A negative second derivative (f''(x) < 0) indicates a graph that is concave down, where the rate of change of the slope is decreasing.
- 🔄 Inflection points occur where the graph changes concavity, which happens when the second derivative is zero or undefined.
- ✅ The second derivative test can be used to determine if a critical point is a relative maximum or minimum by checking the sign of the second derivative at that point.
- ↗️ If the second derivative is positive at a critical point, it indicates a relative minimum.
- ↙️ If the second derivative is negative at a critical point, it indicates a relative maximum.
- 📋 To sketch a graph based on given derivatives, plot the points where the first derivative is zero, identify intervals of concavity, and ensure the graph reflects the correct slopes and concavity changes.
- 🤔 The first derivative indicates increasing or decreasing intervals of the function, while the second derivative gives information about the graph's concavity.
- 🔢 Polynomial functions are particularly suited for using the second derivative test due to the ease of finding successive derivatives.
- 🚫 The second derivative test should be avoided for functions where finding the second derivative is complex, such as those requiring the quotient rule and chain rule.
- 📊 The overall shape of a graph, such as whether it is an upward or downward parabola, exponential growth, or other forms, can be determined by analyzing the signs of the first and second derivatives.
Q & A
What is the second derivative in the context of driving a car?
-The second derivative, in the context of driving a car, represents acceleration. It is the rate of change of the speed or velocity, which is the first derivative of distance.
How does the second derivative relate to the concavity of a graph?
-The second derivative determines the concavity of a graph. If the second derivative is negative, the graph is concave down, and if it is positive, the graph is concave up.
What is an inflection point?
-An inflection point is a point on the graph where the concavity changes. It is identified where the second derivative is zero or undefined.
How can you determine if a function is concave up or concave down by looking at the graph?
-You can determine if a function is concave up or down by observing the slopes of the tangent lines. If the slopes are increasing, the function is concave up. If the slopes are decreasing, the function is concave down.
What does the second derivative test indicate about a critical point?
-The second derivative test, or the concavity test, indicates that if a critical point (where the first derivative is zero or undefined) has a positive second derivative, the function has a relative minimum at that point. If the second derivative is negative, the function has a relative maximum.
What is the relationship between the first and second derivatives and the increasing or decreasing nature of a function?
-The first derivative represents the slope of the tangent line to the curve at a given point and can tell you if the function is increasing or decreasing. A positive first derivative indicates an increasing function, while a negative first derivative indicates a decreasing function. The second derivative represents the concavity and can indicate where the rate of change of the function is itself increasing or decreasing.
How can you sketch a graph when given the first and second derivative values at certain points?
-You can sketch a graph by plotting the given points, identifying intervals where the tangent line is horizontal (first derivative is zero), and determining the concavity (from the second derivative) to draw the shape of the graph accordingly. You would also mark the inflection points where the concavity changes.
What is the significance of the second derivative being zero in relation to inflection points?
-A value of zero for the second derivative is a necessary condition for an inflection point, as it indicates a change in concavity. However, it is not sufficient on its own, as the sign of the second derivative must also change around that point.
How does the second derivative help in identifying relative maxima and minima?
-The second derivative test states that if the second derivative is positive (concave up) at a critical point, the function has a relative minimum there. Conversely, if the second derivative is negative (concave down) at a critical point, the function has a relative maximum.
What is the role of the first derivative in determining the intervals of increase and decrease?
-The sign of the first derivative can help determine the intervals where the function is increasing or decreasing. If the first derivative is positive, the function is increasing, and if it is negative, the function is decreasing.
Why is it important to consider the second derivative when analyzing the shape of a function's graph?
-The second derivative provides information about the concavity of the graph and the behavior of the slope of the tangent line. It is crucial for identifying inflection points and determining whether a function has a relative maximum or minimum at a given critical point.
Outlines
📈 Introduction to Second Derivatives for Classifying Extrema and Sketching Graphs
The video begins with an introduction to second derivatives, explaining how they can be used to classify maximum and minimum values of functions. It uses the analogy of driving a car to illustrate the concept of derivatives, with the first derivative representing speed (velocity) and the second derivative representing acceleration. The video also discusses how the sign of the second derivative can indicate whether a graph is concave up or down, with a positive second derivative indicating concavity upwards and a negative one indicating concavity downwards. The importance of understanding the concavity of a graph is emphasized, and the video sets the stage for further exploration of this topic.
🔍 Identifying Inflection Points and Concavity Intervals
This paragraph delves into the process of identifying inflection points and the intervals where a function is concave up or down. It explains that an inflection point is where the concavity of a graph changes. The video demonstrates how to analyze a graph to determine these points and intervals, using the second derivative as a guide. The concept of concavity is further explored with examples, including how to recognize when a graph is concave up or down and how to identify points of inflection. The video also clarifies the difference between an inflection point (a specific x, y coordinate) and an interval of concavity (a range of x values).
🎨 Sketching Graphs Using Derivative Information
The focus shifts to sketching graphs based on the information provided by the first and second derivatives. The video outlines how to use specific derivative values at certain points to construct a graph that matches the given characteristics. It emphasizes the importance of plotting points, understanding where horizontal tangent lines occur, and recognizing changes in concavity. The process of sketching a graph is demonstrated step by step, showing how to incorporate points, tangent lines, and concavity to create an accurate representation of the function.
🤔 Applying the Second Derivative Test for Relative Extrema
The video introduces the second derivative test, also known as the concavity test, for determining relative extrema (maximum or minimum values) of a function. It explains that if a function is concave up at a critical point (where the first derivative is zero or undefined), the function has a relative minimum at that point. Conversely, if the function is concave down at a critical point, it has a relative maximum. The video illustrates how to apply this test to a function and discusses the implications of the second derivative's sign on the function's behavior.
🧮 Working Through Examples Using the Second Derivative
The presenter works through several examples to demonstrate the application of the second derivative in finding relative extrema, points of inflection, and sketching graphs. Each example involves finding the first and second derivatives of a given function, identifying critical points, and using the second derivative to determine concavity and classify extrema. The video also shows how to find inflection points where the concavity changes. The process is made clear through step-by-step calculations and graphical analysis.
📚 Summary of Key Concepts and Practice Advice
The video concludes with a summary of the key concepts covered, including the use of second derivatives to determine concavity, identify inflection points, and classify relative maxima and minima. It emphasizes the utility of the second derivative test in quickly identifying relative extrema and the importance of practice in mastering these concepts. The presenter encourages viewers to continue practicing and assures them that their understanding and proficiency will improve with time.
Mindmap
Keywords
💡Second Derivative
💡Concavity
💡Inflection Point
💡Critical Value
💡Second Derivative Test
💡Tangent Line
💡Velocity and Acceleration
💡
💡Relative Maximum and Minimum
💡Derivative
💡Graph Sketching
💡Increasing/Decreasing Intervals
Highlights
The second derivative is defined as the rate of change of the first derivative, which can be visualized as the rate of change of the slope of a tangent line to a curve.
A graph is concave down when the second derivative is negative, indicating that the rate of change of the slope is decreasing.
Conversely, a graph is concave up when the second derivative is positive, meaning the rate of change of the slope is increasing.
The concept of concavity can apply to a variety of graphs, not just parabolas; for example, an exponential graph is also concave up.
An inflection point is a specific point on a graph where the concavity changes, which can be determined by where the second derivative is zero or undefined.
The second derivative test (f double prime test) can be used to determine if a critical point is a relative minimum or maximum by evaluating the concavity at that point.
If the second derivative is positive at a critical point, the function has a relative minimum at that point.
If the second derivative is negative at a critical point, the function has a relative maximum at that point.
The process of sketching a graph using given derivative information involves plotting points, determining intervals of increasing/decreasing, and evaluating concavity.
The second derivative can be used to find inflection points and intervals of concavity, which are essential for a complete graph sketch.
The second derivative test is particularly useful for polynomial functions where the second derivative is easily calculable.
When the second derivative is a constant, the concavity of the graph does not change, and there are no inflection points.
The second derivative test can quickly identify relative extrema, but the first derivative test may be necessary for points where the second derivative is zero.
The transcript provides a step-by-step guide to using the second derivative to analyze the behavior of a function, including finding relative extrema and inflection points.
Understanding the relationship between the first and second derivative is crucial for classifying the behavior of a function and sketching its graph accurately.
The second derivative can help in determining the shape of the graph without necessarily plotting the entire graph, which is useful for complex functions.
The method of using the second derivative to analyze a function's graph is applicable to a wide range of mathematical problems and practical applications.
Transcripts
Browse More Related Video

3.2 - Using Second Derivatives to Classify Max and Min Values
Concavity and the 2nd Derivative Test
AP Calculus AB: Lesson 2.4 The Second Derivative
Concavity introduction | Using derivatives to analyze functions | AP Calculus AB | Khan Academy
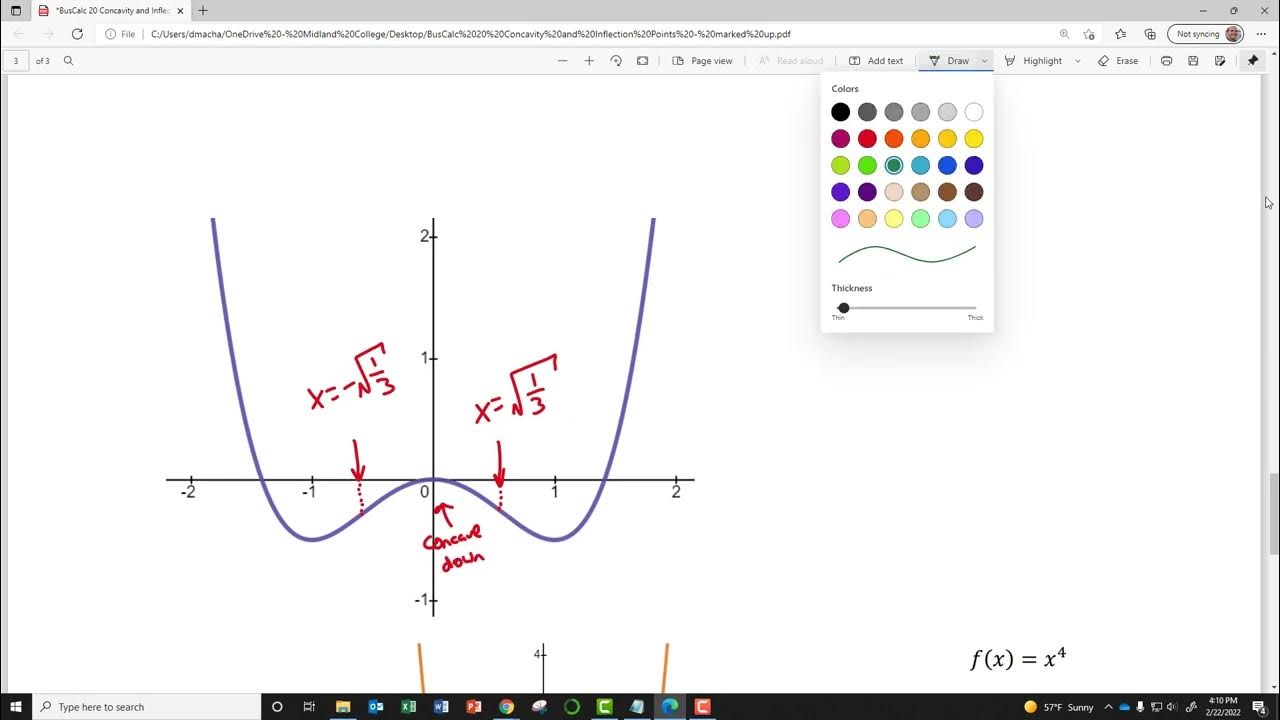
BusCalc 20 Concavity and Inflection Points

Business Calculus - Math 1329 - Section 3.2 - Concavity and Points of Inflection
5.0 / 5 (0 votes)
Thanks for rating: