Mean Absolute Deviation - Statistics
TLDRThe video explains how to calculate the mean absolute deviation, a measure of the average distance between data points and the mean. It first walks through an example using a table to visualize taking the difference and absolute difference between each data point and the mean. It then shows the calculation using the formula, where you sum the absolute differences divided by n. It provides a second example solving directly with the formula. Finally, it visually depicts the distances on a number line to explain conceptually what mean absolute deviation indicates - the average distance of the data points from the mean.
Takeaways
- 😀 The mean absolute deviation measures the average distance of all the values from the mean
- 📊 To calculate it: Take the absolute difference between each data point and the mean, sum them up, and divide by n
- 📈 First calculate the arithmetic mean by summing all values and dividing by n
- ☑️ Subtract each data point from the mean and take the absolute values
- ✅ Sum the absolute differences and divide by n to get the mean absolute deviation
- 📋 Can use a table with columns for X values, mean, differences, and absolute differences
- 🖥 Or directly apply the formula without a table
- 👁🗨 Visualizing the deviations on a number line shows how far points are from the mean
- 🎯 The mean absolute deviation tells us the average distance values are from the mean
- 🤓 Useful for understanding spread and variation in a data set
Q & A
What does the mean absolute deviation measure?
-The mean absolute deviation measures the average distance of all the values from the mean.
What are the steps to calculate mean absolute deviation using a table?
-The steps are: 1) Calculate the arithmetic mean; 2) Subtract each data point from the mean; 3) Take the absolute value of the differences; 4) Sum the absolute differences; 5) Divide the sum by n.
How is the mean calculated?
-The mean is calculated by taking the sum of all the data points and dividing by the total number of data points (n).
Why do we take the absolute value of the differences?
-We take the absolute value so that the negative differences become positive. This allows us to sum the differences.
What is the formula to calculate mean absolute deviation without a table?
-The formula is: Mean Absolute Deviation = (absolute value of (x1 - mean) + absolute value of (x2 - mean) + ... + absolute value of (xn - mean)) / n
What does the mean absolute deviation value signify?
-The mean absolute deviation value signifies the average distance of the data points from the mean. It tells us how far, on average, the data points are from the mean.
Does the order of the data points matter when calculating mean absolute deviation?
-No, the order of the data points does not matter. The mean absolute deviation depends only on the difference of each data point from the mean, not their order.
Can the mean absolute deviation be zero?
-Yes, if all the data points have the same value, which is also the mean, then the mean absolute deviation will be zero.
Is a small or large mean absolute deviation better?
-A small mean absolute deviation is better because it indicates the data points are clustered closely around the mean.
What are some real-world uses of mean absolute deviation?
-Mean absolute deviation is used in statistics and finance to measure forecast error, assess risk, compare predictors, etc.
Outlines
📏 Calculating Mean Absolute Deviation
This paragraph explains how to calculate the mean absolute deviation. It provides an example using a table with values of 7, 11, 14, 19, 22, and 29. It steps through the calculation of the mean (17), difference of each data point from the mean, absolute value of the differences, sum of absolute differences (38), and the final mean absolute deviation (38/6 = 6.3 repeating).
😄 Visual Understanding of Mean Absolute Deviation
This paragraph provides a second example calculating mean absolute deviation for values 5, 9, 12, 16, 18. It finds the mean is 12, calculates the absolute deviations from 12, sums them (20), and divides by 5 data points to get the final mean absolute deviation of 4. It then explains this visually on a number line, showing that on average, the numbers are 4 units away from the mean of 12.
Mindmap
Keywords
💡Mean absolute deviation
💡Arithmetic mean
💡Absolute difference
💡Number line
💡Units
💡Summation
💡Formula
💡Data points
💡Dataset
💡Spread
Highlights
The mean absolute deviation measures the average distance of all the values from the mean
To calculate it: 1) Calculate the arithmetic mean 2) Subtract each data point from the mean 3) Take the absolute value of the differences 4) Sum the absolute differences 5) Divide the sum by the number of data points
Illustrated the calculation using a table with columns for: the data points, the mean, the difference of each point from the mean, and the absolute difference of each point from the mean
The final formula: Mean absolute deviation = Sum of absolute differences / Number of data points
Worked through another example by directly applying the formula without using a table
Visualized the meaning of mean absolute deviation on a number line by showing the distance of each data point from the mean
On average each number is about four units away from the mean on average
The mean absolute deviation provides a measure of variability and how dispersed the data is from the mean value
Using a table breakdown makes the calculation steps clear but the formula can calculate it directly
Taking the absolute value before summing eliminates the cancellation of positive and negative differences
Dividing the sum of absolute differences by the number of data points gives an average distance from the mean
The number line visualization shows how each data point differs from the calculated mean value
Smaller mean absolute deviation indicates the data points are clustered closer to the mean
Larger mean absolute deviation indicates the data points are more spread out from the mean
Mean absolute deviation complements standard deviation as a statistic for variability
Transcripts
Browse More Related Video

What is Standard Deviation and Mean Absolute Deviation | Math, Statistics for data science, ML
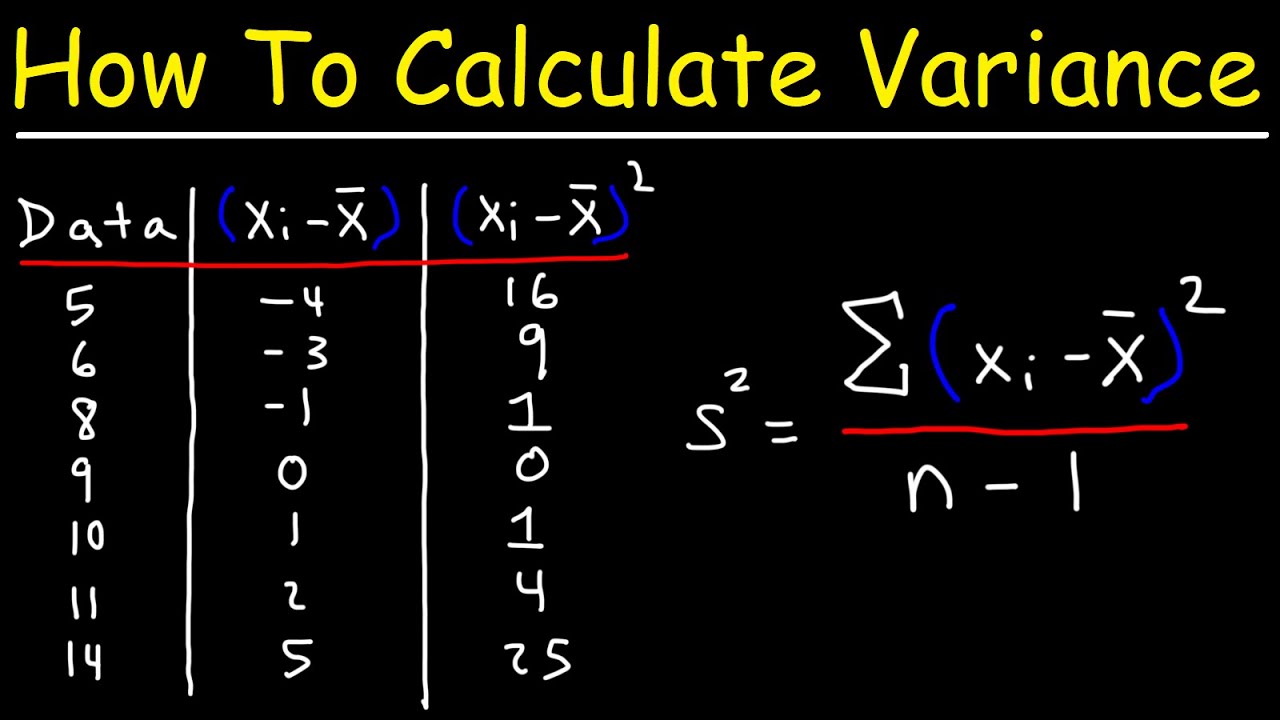
How To Calculate Variance
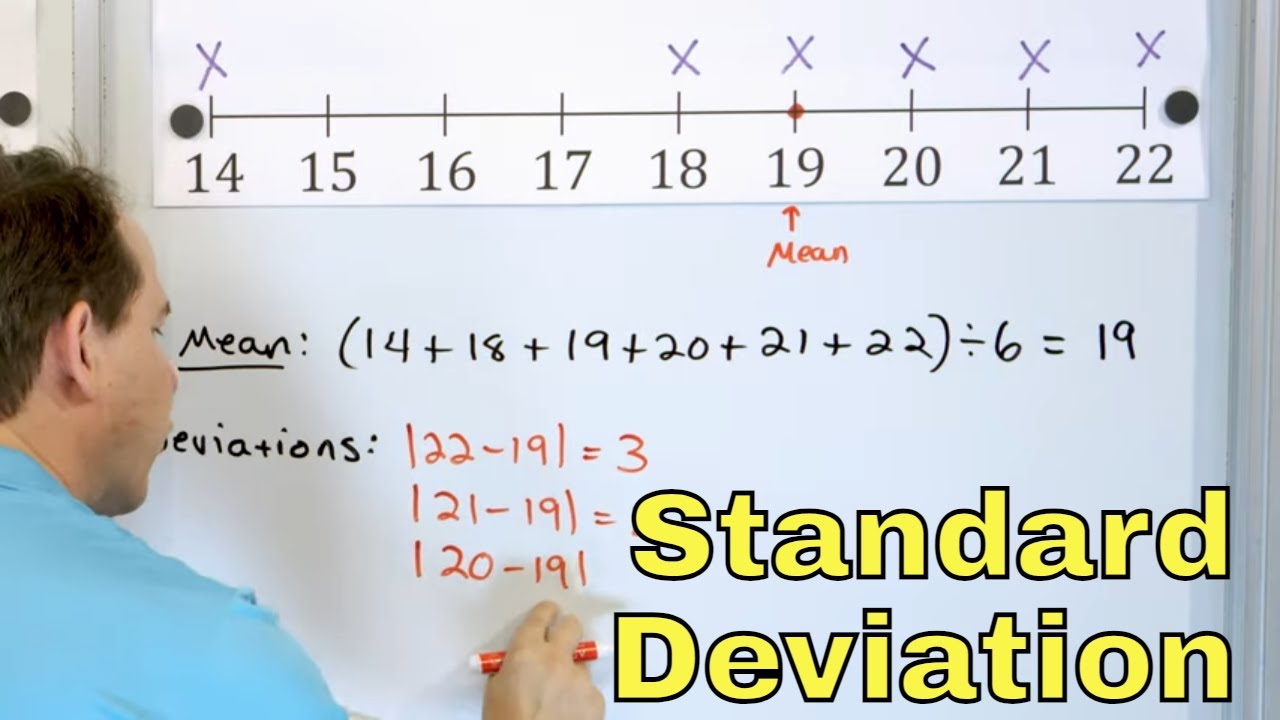
Standard Deviation & Mean Absolute Deviation Explained - 6-8-19]
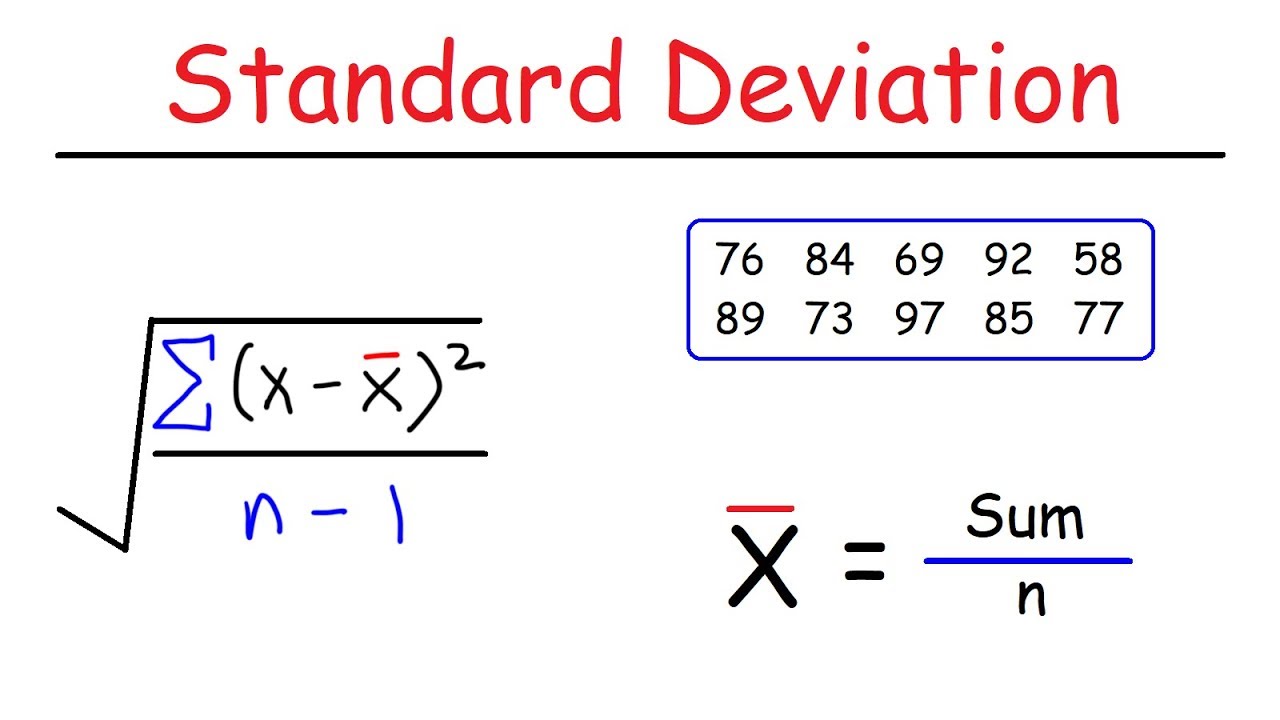
How To Calculate The Standard Deviation

What is a "Standard Deviation?" and where does that formula come from

Mean Absolute Deviation
5.0 / 5 (0 votes)
Thanks for rating: