Mean, Median, Mode, and Range - How To Find It!
TLDRThe video explains how to calculate statistical measures - mean, median, mode and range - for a dataset. It provides step-by-step workings for sample datasets, explaining how to arrange the numbers in order, add them up, divide by total numbers to get the mean, identify the middle number for the median, spot the most frequent number for the mode, and find the difference between the maximum and minimum for the range. It also covers special cases like even number of data points and no mode. The goal is to enable viewers to apply these techniques to summarize and compare any datasets they encounter.
Takeaways
- 😀 To find the mean, add up all the numbers and divide by the total count
- 😎 To find the median, arrange the numbers in order and pick the middle number
- 😉 The mode is the number that appears most frequently
- 🧐 The range is the difference between the highest and lowest number
- 👍 When there are an even number of data points, average the two middle numbers for median
- 🤓 Work through examples with different size data sets to practice calculations
- 😊 Put the numbers in increasing order to easily identify median and mode
- 🤔 If each number appears once, there is no mode for that data set
- 😯 For larger even data sets, identify midpoint of middle pair for median
- 😃 Practice problems allow application of statistical concepts
Q & A
What are the four measures of central tendency discussed in the video?
-The four measures of central tendency discussed are mean, median, mode and range.
How do you calculate the mean?
-To calculate the mean, add up all the numbers in the data set and divide the sum by the total count of numbers.
What is the first step to find the median?
-The first step is to arrange the numbers in the data set in increasing order from lowest to highest.
How do you find the median if there is an even number of data points?
-With an even number of data points, the median is calculated by taking the average of the two middle numbers.
What does mode signify in a data set?
-The mode is the number that appears most frequently in a data set.
How is range calculated?
-The range is calculated by taking the difference between the highest and lowest numbers in a data set.
What happens when there are two middle numbers while finding the median?
-When there are two middle numbers, you calculate the average of those numbers to determine the median.
What does it mean if there is no mode for a data set?
-If there is no mode for a data set, it means that no number occurs more frequently than the others.
Why is it important to arrange numbers in order while finding the median?
-Arranging the numbers in order makes it easier to identify the middle number(s) which is needed to calculate the median.
What happens if the data set contains an even number of values?
-With an even number of values, there will be two middle numbers. In that case, the median is calculated by taking the average of those two middle numbers.
Outlines
🧮 Calculating mean, median, mode and range
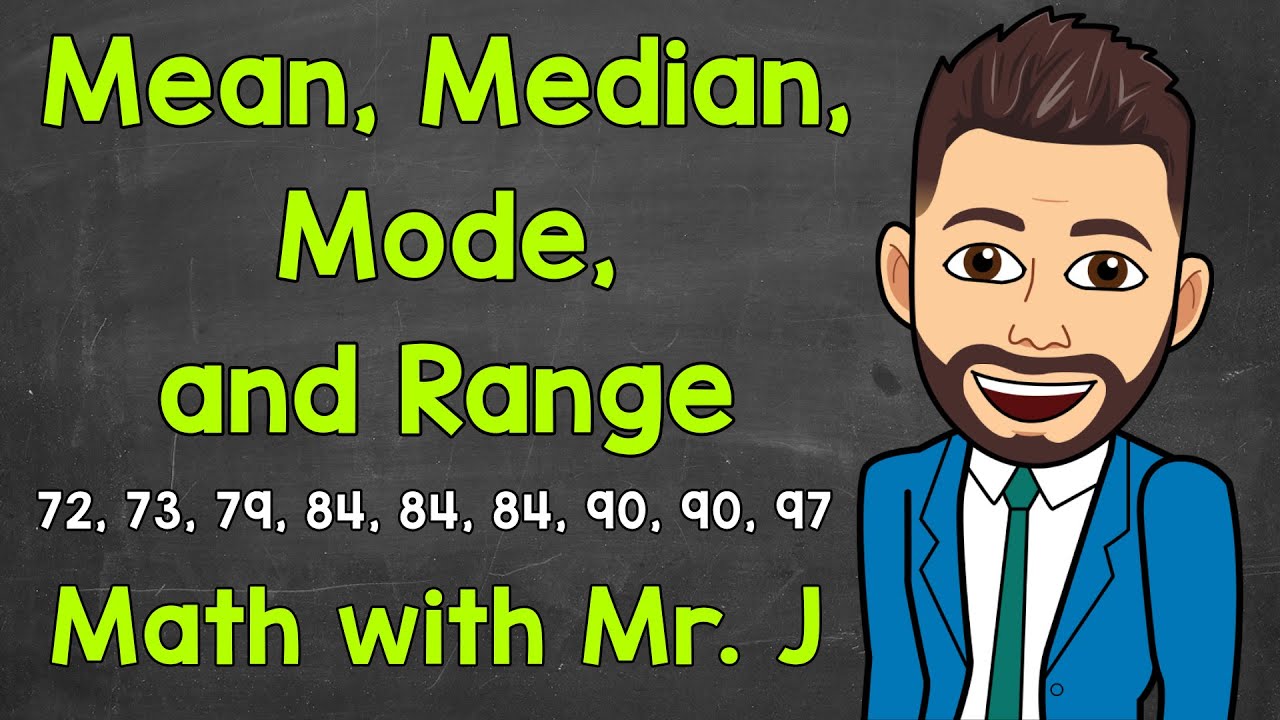
In the first paragraph, we learn how to calculate the mean, median, mode and range for a data set with 7 numbers. We sum the numbers and divide by 7 to get the mean. We arrange the numbers in order to find the median which is the middle number. The number that appears most often is the mode. The range is the difference of the highest and lowest numbers.
📊 Finding statistical measures for more examples
The second paragraph provides another example with 7 numbers to calculate the mean, median, mode and range. It also discusses an even number case with 8 numbers, and how to calculate the median when there are two middle numbers. We take their average. Finally it introduces one more example with 10 numbers to find all the statistical measures.
😆 Determining median for data sets with even number of terms
The third paragraph specifically focuses on determining the median when there is an even number of data points. It uses the example with 10 numbers, eliminates the highest and lowest values in pairs until reaching the middle two numbers. We then take their average to find the median.
Mindmap
Keywords
💡mean
💡median
💡mode
💡range
💡frequency
💡data set
💡central tendency
💡outlier
💡sample
💡spread
Highlights
To find the mean, take the sum of the numbers and divide by the total numbers.
To find the median, arrange the numbers in order and pick the middle number.
The mode is the number that appears most frequently.
The range is the difference between the highest and lowest numbers.
With an odd number of data points, the median is the single middle number.
With an even number of data points, the median is the average of the two middle numbers.
When there are no repeats, there is no mode.
Always put the numbers in order first to easily see the middle and extremes.
Practice problems allow you to apply the concepts on your own.
The mean uses the sum of all numbers unlike the median and mode which focus on middle and frequent numbers.
An even number of data points requires a slightly different median calculation.
Work through examples with different numbers of data points.
Calculating range is consistent regardless of even or odd data points.
Understand how to adapt the median calculation when there are an even number of data points.
Practice and repetition with different data sets reinforces understanding.
Transcripts
Browse More Related Video

Mode, Median, Mean, Range, and Standard Deviation (1.3)
Mean, Median, Mode, and Range | Math with Mr. J

Mean, Median, Mode, and Range using Legos
Finding Mean, Median, and Mode | Math with Mr. J
Finding mean, median, and mode | Descriptive statistics | Probability and Statistics | Khan Academy
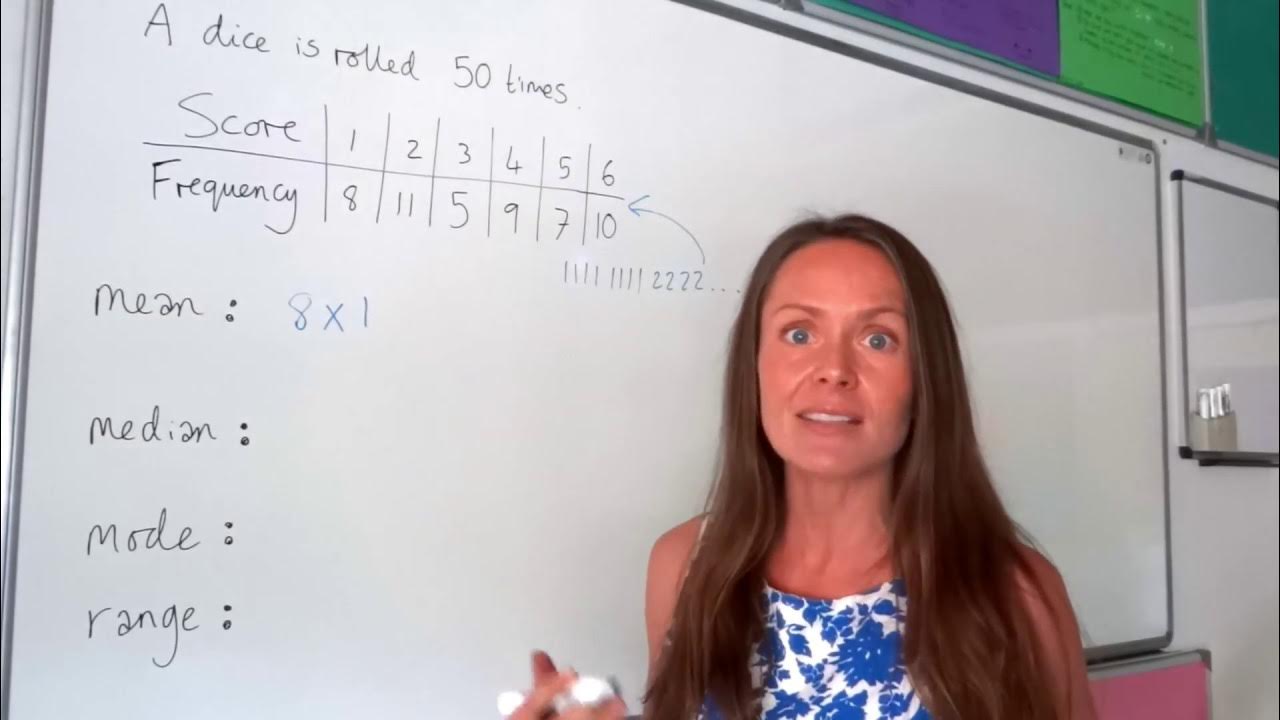
The Maths Prof: Frequency Tables (Mean, Median, Mode & Range)
5.0 / 5 (0 votes)
Thanks for rating: