Skewness - Right, Left & Symmetric Distribution - Mean, Median, & Mode With Boxplots - Statistics
TLDRThe video discusses different types of distributions in statistics - symmetric, skewed right, and skewed left. It explains how to identify each one based on the mean, median, and mode, as well as by the shape of boxplots. For a symmetric distribution, the mean/median/mode are all equal. For right skew, the mean > median > mode, while for left skew, mean < median < mode. The script also shows how to recognize right vs left skew based on comparing lengths of boxplot components.
Takeaways
- 😀 A symmetric distribution has an identical left and right side, with the mean, median and mode all at the center
- 👉 A unimodal distribution has one peak or mode, a bimodal has two peaks, and a trimodal has three peaks
- 🔎 In a symmetric distribution, the interquartile range on both sides of the median are equal
- 📈 A right skewed distribution has a longer right tail, with the mean greater than the median
- ⬅️ A left skewed distribution has a longer left tail, with the mean less than the median
- 💡 In a right skew, the mean is greater than the median which is greater than the mode
- ↔️ In a left skew, the mean is less than the median which is less than the mode
- 📊 A right skew box plot has a longer right box and/or whisker compared to the left side
- 📉 A left skew box plot has a longer left box and/or whisker compared to the right side
- 🎓 Understanding distribution shapes and skewness helps make sense of statistical data
Q & A
What are the three main types of distributions discussed in the video?
-The three main types of distributions discussed are symmetric distributions, distributions skewed to the right, and distributions skewed to the left.
How can you identify if a distribution is symmetric?
-A distribution is symmetric if a line drawn through the middle results in two identical sides, the mean equals the median, and the left whiskers of a boxplot are equal in length to the right whiskers.
What are some ways to identify if a distribution is skewed to the right?
-Signs of right skew include: a longer right tail, the mean being greater than the median, the median being greater than the mode, the right box of a boxplot being longer, the right whisker being longer, or a combination of those.
What is the relationship between the mean, median, and mode in a left skewed distribution?
-In a left skewed unimodal distribution, the mean is less than the median, which is less than the mode.
How can a boxplot show if a distribution is skewed left?
-Signs include: a longer left box, a longer left whisker, the left box being longer than the right box, or the left whisker being longer than the right whisker.
What are some types of multimodal distributions?
-Examples given include bimodal distributions with two peaks/modes and trimodal distributions with three peaks/modes.
Where is the mode located in a distribution and why?
-The mode is located at the highest point/peak in a distribution graph. This represents the value that occurs most frequently.
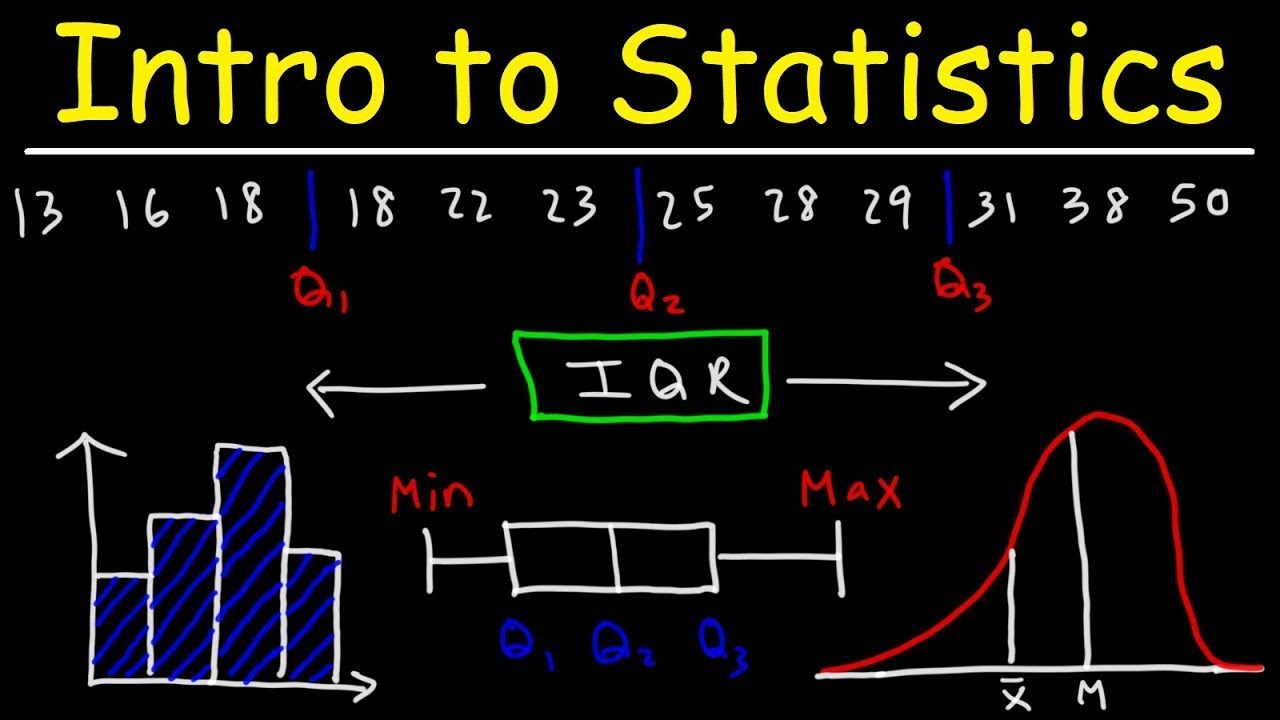
What does a boxplot represent in terms of quantiles?
-The boxplot shows the first quartile (Q1), second quartile (Q2 or median), and third quartile (Q3). The whiskers extend to the minimum and maximum values.
What is positive skew versus negative skew?
-Positive skew refers to data skewed to the right. Negative skew refers to data skewed to the left.
How can you determine if the mean is left or right of the median in a skewed distribution?
-If the distribution is right skewed, the mean is greater than (to the right of) the median. If left skewed, the mean is less than (to the left of) the median.
Outlines
😊 Overview of distribution shapes and key terms
Introduces and defines symmetric, skewed, unimodal, bimodal and trimodal distributions. Explains the relationship between mean, median and mode in a symmetric distribution. Provides visual examples of uni, bi and trimodal graphs.
😃 Skewed right distribution and box plots
Defines positive skew distribution with longer right tail. Explains the relationship between mean, median and mode, with mean > median > mode. Provides examples of right skewed box plots based on relative quartile ranges and whisker lengths.
😉 Skewed left distribution and box plots
Defines negative skew distribution with longer left tail. Explains the relationship between mean, median and mode, with mean < median < mode. Provides examples of left skewed box plots based on relative quartile ranges and whisker lengths.
Mindmap
Keywords
💡distribution
💡symmetric
💡skewed
💡unimodal
💡mean
💡median
💡mode
💡boxplot
💡quartiles/Q1/Q2/Q3
💡whiskers
Highlights
A symmetric distribution has an identical left and right side, with the mean, median, and mode all at the center
A unimodal distribution has one peak or mode, while a bimodal has two and a trimodal has three
For a symmetric distribution, the box plot has equal lengths on both sides, representing identical quartile ranges
A right skewed distribution has more values clustered to the left with a longer tail stretching out to the right
In a right skewed distribution, the mean is greater than the median, and the median is greater than the mode
A box plot for a right skewed distribution may have an unequal box length, whisker length, or both on each side
A left skewed distribution has more values clustered to the right with a longer tail stretching out to the left
In a left skewed distribution, the mean is less than the median, which is less than the mode
A box plot for a left skewed distribution may have a longer box, whisker, or both on the left side
Symmetric distributions have the mean, median, and mode aligned at the center
Skewed distributions have the mean and median separated, with the mode at the high point
Box plots visually show symmetry or skewness based on comparative lengths of boxes and whiskers on each side
Right skew means the tail stretches higher values, with mean > median > mode
Left skew means the tail stretches lower values, with mean < median < mode
Skewness relates to asymmetry and differing spreads of values on each side of central tendency measures
Transcripts
Browse More Related Video

Statistics-Left Skewed And Right Skewed Distribution And Relation With Mean, Median And Mode
Analyzing Sets of Data: Range, Mean, Median, and Mode
Mean, Median, and Mode: Measures of Central Tendency: Crash Course Statistics #3
Descriptive Statistics: The Mode
Introduction to Statistics

What is Descriptive Statistics ... [Examples and Concept - Mean Median Mode]
5.0 / 5 (0 votes)
Thanks for rating: